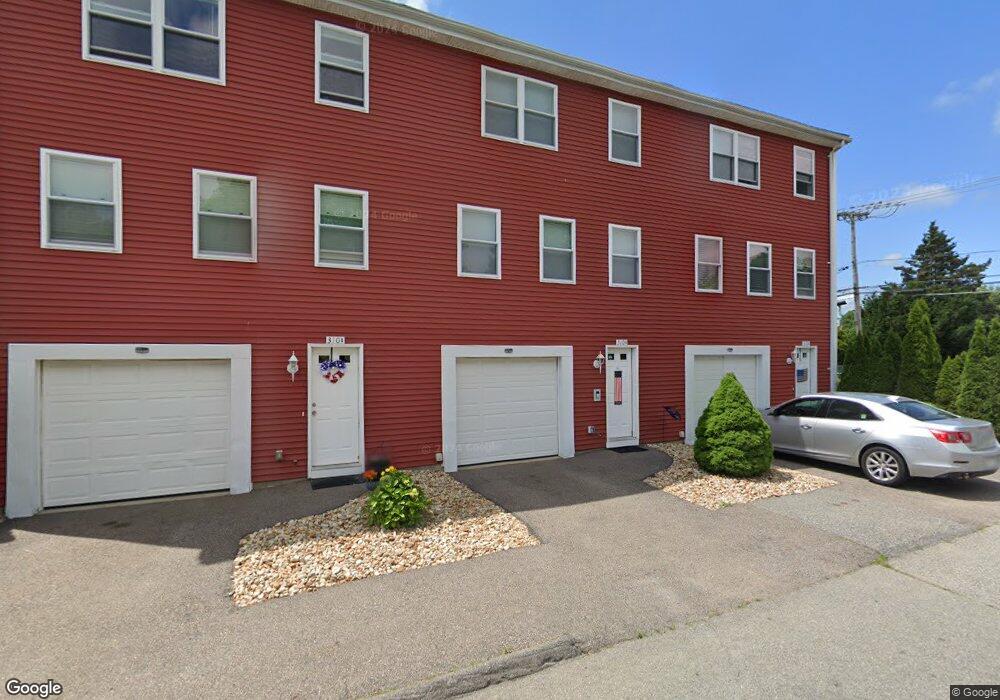
310 N Varley St Unit A Fall River, MA 02723
Oak Grove Village NeighborhoodEstimated Value: $208,000 - $302,184
2
Beds
2
Baths
1,160
Sq Ft
$225/Sq Ft
Est. Value
About This Home
This home is located at 310 N Varley St Unit A, Fall River, MA 02723 and is currently estimated at $261,296, approximately $225 per square foot. 310 N Varley St Unit A is a home located in Bristol County with nearby schools including Mary Fonseca Elementary School, Talbot Innovation School, and B M C Durfee High School.
Ownership History
Date
Name
Owned For
Owner Type
Purchase Details
Closed on
Dec 29, 2017
Sold by
Trahan Jessica S and Trahan Adam E
Bought by
Novo Leonel R
Current Estimated Value
Home Financials for this Owner
Home Financials are based on the most recent Mortgage that was taken out on this home.
Original Mortgage
$128,250
Outstanding Balance
$108,255
Interest Rate
3.95%
Mortgage Type
New Conventional
Estimated Equity
$153,041
Purchase Details
Closed on
Feb 25, 2016
Sold by
Tavares Jessica S
Bought by
Trahan Jessica S and Trahan Adam E
Create a Home Valuation Report for This Property
The Home Valuation Report is an in-depth analysis detailing your home's value as well as a comparison with similar homes in the area
Home Values in the Area
Average Home Value in this Area
Purchase History
| Date | Buyer | Sale Price | Title Company |
|---|---|---|---|
| Novo Leonel R | $142,500 | -- | |
| Trahan Jessica S | -- | -- |
Source: Public Records
Mortgage History
| Date | Status | Borrower | Loan Amount |
|---|---|---|---|
| Open | Novo Leonel R | $128,250 |
Source: Public Records
Tax History
| Year | Tax Paid | Tax Assessment Tax Assessment Total Assessment is a certain percentage of the fair market value that is determined by local assessors to be the total taxable value of land and additions on the property. | Land | Improvement |
|---|---|---|---|---|
| 2025 | $2,764 | $241,400 | $0 | $241,400 |
| 2024 | $2,693 | $234,400 | $0 | $234,400 |
| 2023 | $2,649 | $215,900 | $0 | $215,900 |
| 2022 | $2,447 | $201,300 | $0 | $201,300 |
| 2021 | $2,447 | $176,900 | $0 | $176,900 |
| 2020 | $2,105 | $145,700 | $0 | $145,700 |
| 2019 | $2,056 | $141,000 | $0 | $141,000 |
| 2018 | $1,760 | $120,400 | $0 | $120,400 |
| 2017 | $1,686 | $120,400 | $0 | $120,400 |
| 2016 | $1,596 | $117,100 | $0 | $117,100 |
| 2015 | $1,424 | $108,900 | $0 | $108,900 |
| 2014 | $1,473 | $117,100 | $0 | $117,100 |
Source: Public Records
Map
Nearby Homes
- 217 Plain St
- 218 Plain St
- 992 Pine St
- 884 Cherry St
- 273 Tremont St
- 243 Robeson St Unit 6
- 243 Robeson St Unit 3
- 45-47 Shawmut St
- 545 Robeson St
- 869 Bedford St
- 84 Healy St
- 243 Oak Grove Ave
- 631 Walnut St
- 105 16th St
- 120 15th St Unit 5
- 610 Walnut St
- 10 Carlisa Dr
- 511 Bank St
- 139 Quarry St
- 528 Cherry St Unit 3
Your Personal Tour Guide
Ask me questions while you tour the home.