Estimated Value: $256,000 - $270,000
3
Beds
3
Baths
1,403
Sq Ft
$188/Sq Ft
Est. Value
About This Home
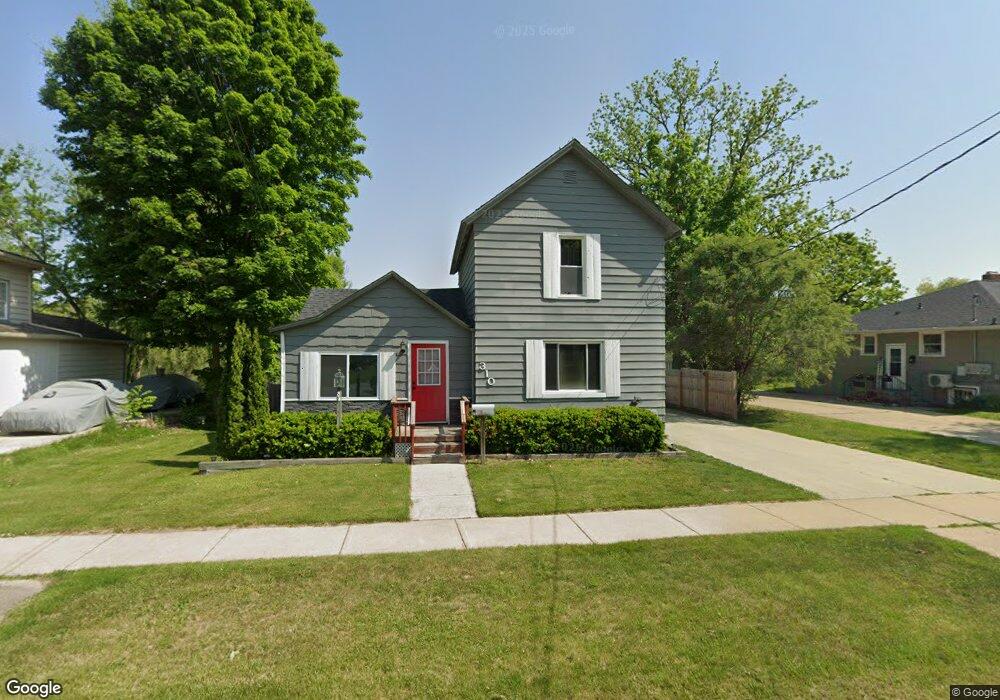
This home is located at 310 North St Unit Bldg-Unit, Holly, MI 48442 and is currently estimated at $263,566, approximately $187 per square foot. 310 North St Unit Bldg-Unit is a home located in Oakland County with nearby schools including Holly High School, Holly Academy, and Adelphian Junior Academy.
Ownership History
Date
Name
Owned For
Owner Type
Purchase Details
Closed on
Nov 15, 2019
Sold by
James R Ives Trust
Bought by
Schneider Brett W and Schneider Elizabeth A
Current Estimated Value
Purchase Details
Closed on
Jun 15, 2018
Sold by
Ives James R and Ives Diane H
Bought by
Ives James R
Purchase Details
Closed on
Oct 25, 2017
Sold by
Molenda Daniel
Bought by
Lafano Vince
Purchase Details
Closed on
Jan 28, 2013
Sold by
Eh Pooled 1012 Lp
Bought by
Molenda Daniel
Purchase Details
Closed on
Dec 7, 2012
Sold by
U S Bank National Association
Bought by
Eh Pooled 1012 Lp
Purchase Details
Closed on
Mar 13, 2012
Sold by
Williams Eric and Williams Danyelle
Bought by
Us Bank National Association
Purchase Details
Closed on
Sep 12, 2003
Sold by
Moore Sue Ann and Raby Dorothy Irene
Bought by
Williams Eric and Williams Danyelle
Purchase Details
Closed on
Feb 27, 1998
Sold by
Bailey Helen V
Bought by
Bailey Helen
Create a Home Valuation Report for This Property
The Home Valuation Report is an in-depth analysis detailing your home's value as well as a comparison with similar homes in the area
Home Values in the Area
Average Home Value in this Area
Purchase History
| Date | Buyer | Sale Price | Title Company |
|---|---|---|---|
| Schneider Brett W | $163,000 | Devon Title Agency | |
| Ives James R | -- | Devon Title Agency | |
| Ives James R | $162,000 | Devon Title Agency | |
| Lafano Vince | $47,000 | None Available | |
| Molenda Daniel | $18,000 | None Available | |
| Eh Pooled 1012 Lp | $11,000 | None Available | |
| Us Bank National Association | $25,680 | None Available | |
| Williams Eric | $99,000 | First American Title | |
| Bailey Helen | -- | -- |
Source: Public Records
Tax History Compared to Growth
Tax History
| Year | Tax Paid | Tax Assessment Tax Assessment Total Assessment is a certain percentage of the fair market value that is determined by local assessors to be the total taxable value of land and additions on the property. | Land | Improvement |
|---|---|---|---|---|
| 2024 | $3,411 | $113,450 | $0 | $0 |
| 2023 | $3,235 | $102,800 | $0 | $0 |
| 2022 | $3,468 | $92,730 | $0 | $0 |
| 2021 | $4,723 | $84,940 | $0 | $0 |
| 2020 | $4,413 | $78,580 | $0 | $0 |
| 2019 | $3,238 | $72,040 | $0 | $0 |
| 2018 | $3,366 | $55,000 | $0 | $0 |
| 2017 | $2,388 | $53,430 | $0 | $0 |
| 2016 | $2,380 | $47,540 | $0 | $0 |
| 2015 | -- | $41,310 | $0 | $0 |
| 2014 | -- | $36,890 | $0 | $0 |
| 2011 | -- | $35,770 | $0 | $0 |
Source: Public Records
Map
Nearby Homes
- 103 Michigan St
- 100 Oakland St
- 108 Bevins St
- 701 Hartner Dr
- 809 Richard St
- 810 Canyon Creek Dr Unit 17
- 106 Lakeview St
- 805 Hartner Dr
- 744 Hartner Dr
- 135 Park Ave
- 205 Park Ave
- 868 Deer Run Lake Rd Unit 87
- 205 Lakeview St
- 107 Oakwood St
- 378 Edge Brook Dr
- 108 College St
- 395 Edge Brook Dr
- 386 Edge Brook Dr
- 376 Edge Brook Dr
- 109 Oakwood St