Estimated Value: $420,000 - $456,094
3
Beds
2
Baths
1,104
Sq Ft
$395/Sq Ft
Est. Value
About This Home
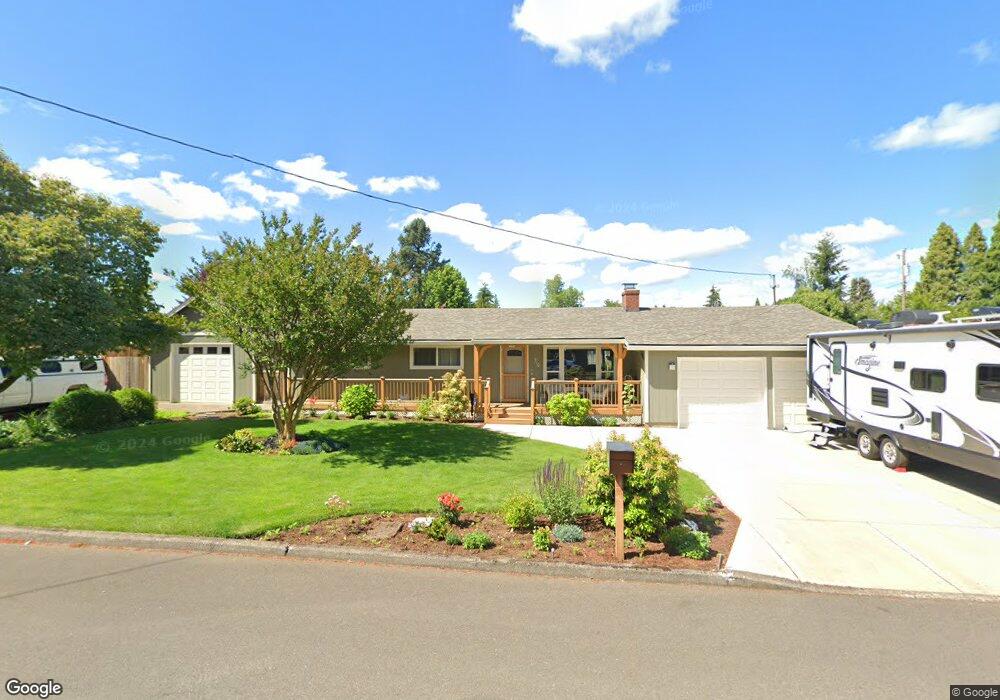
This home is located at 310 NW 9th Ave, Canby, OR 97013 and is currently estimated at $436,024, approximately $394 per square foot. 310 NW 9th Ave is a home located in Clackamas County with nearby schools including Josefa L. Sambrano Elementary School, Baker Prairie Middle School, and Canby High School.
Ownership History
Date
Name
Owned For
Owner Type
Purchase Details
Closed on
Aug 7, 2019
Sold by
Mcintyre Michael and Mcintyre Kelly
Bought by
Marsonette Wayne W and Marsonette Sandra L
Current Estimated Value
Purchase Details
Closed on
Jun 22, 2005
Sold by
Thomas Randy J and Thomas Lori A
Bought by
Mcintyre Michael and Mcintyre Kelly
Home Financials for this Owner
Home Financials are based on the most recent Mortgage that was taken out on this home.
Original Mortgage
$37,940
Interest Rate
5.27%
Mortgage Type
Stand Alone Second
Purchase Details
Closed on
May 18, 1999
Sold by
Hemmerling Beulah L
Bought by
Thomas Randy J and Thomas Lori A
Home Financials for this Owner
Home Financials are based on the most recent Mortgage that was taken out on this home.
Original Mortgage
$79,900
Interest Rate
6.92%
Create a Home Valuation Report for This Property
The Home Valuation Report is an in-depth analysis detailing your home's value as well as a comparison with similar homes in the area
Home Values in the Area
Average Home Value in this Area
Purchase History
| Date | Buyer | Sale Price | Title Company |
|---|---|---|---|
| Marsonette Wayne W | $370,000 | First American | |
| Mcintyre Michael | $189,700 | Chicago Title Insurance Comp | |
| Thomas Randy J | $74,500 | Chicago Title Insurance Co |
Source: Public Records
Mortgage History
| Date | Status | Borrower | Loan Amount |
|---|---|---|---|
| Previous Owner | Mcintyre Michael | $37,940 | |
| Previous Owner | Mcintyre Michael | $151,760 | |
| Previous Owner | Thomas Randy J | $79,900 |
Source: Public Records
Tax History Compared to Growth
Tax History
| Year | Tax Paid | Tax Assessment Tax Assessment Total Assessment is a certain percentage of the fair market value that is determined by local assessors to be the total taxable value of land and additions on the property. | Land | Improvement |
|---|---|---|---|---|
| 2025 | $2,807 | $189,995 | -- | -- |
| 2024 | $2,728 | $184,462 | -- | -- |
| 2023 | $2,728 | $179,090 | $0 | $0 |
| 2022 | $2,509 | $173,874 | $0 | $0 |
| 2021 | $2,416 | $168,810 | $0 | $0 |
| 2020 | $2,373 | $163,894 | $0 | $0 |
| 2019 | $2,710 | $159,121 | $0 | $0 |
| 2018 | $2,650 | $154,486 | $0 | $0 |
| 2017 | $2,583 | $149,986 | $0 | $0 |
| 2016 | $2,496 | $145,617 | $0 | $0 |
| 2015 | $2,411 | $141,376 | $0 | $0 |
| 2014 | $2,341 | $137,258 | $0 | $0 |
Source: Public Records
Map
Nearby Homes
- 0 NW 10th Ave
- 580 N Grant St
- 184 NE 10th Ave
- 318 NE 9th Ave
- 442 NW 4th Ave
- 187 NE 14th Ave
- 960 N Aspen Ct
- 589 NW 3rd Ave
- 312 NE 14th Ave
- 1614 NW 16th Ave
- 1721 N Hyssop St
- 978 N Alder St
- 812 NW 3rd Ave
- 850 NW 3rd Ave
- 1751 N Laurelwood Loop
- 916 NW 2nd Ave
- 1198 SW 1st Ave
- 431 SW 3rd Ave
- 299 SW 3rd Ave
- 620 SE 2nd Ave
- 945 N Hawthorne Ct
- 390 NW 9th Ave
- 930 N Grant St
- 895 N Hawthorne Ct
- 965 N Hawthorne Ct
- 216 NW 9th Ave
- 890 N Grant St
- 950 N Grant St
- 950 N Hawthorne Ct
- 985 N Hawthorne Ct
- 890 N Hawthorne Ct
- 970 N Grant St
- 805 N Hawthorne Ct
- 850 N Grant St
- 200 NW 9th Ave
- 400 NW 9th Ave
- 980 N Hawthorne Ct
- 935 N Grant St
- 315 NW 10th Ave
- 211 NW 9th Ave