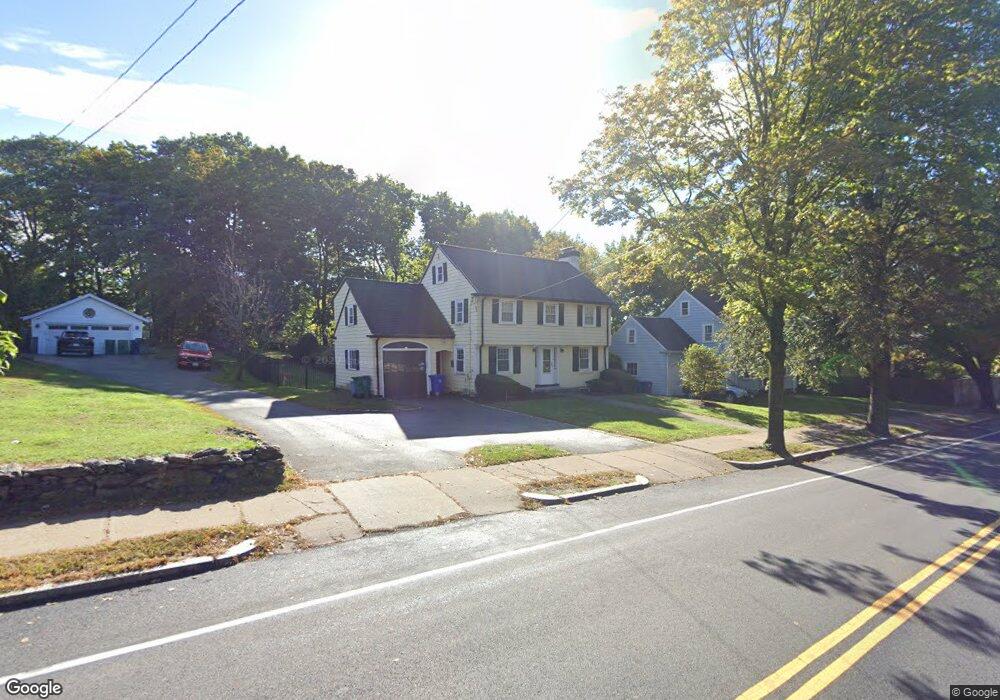
310 Parker St Newton Center, MA 02459
Thompsonville NeighborhoodEstimated Value: $1,329,000 - $1,484,000
4
Beds
3
Baths
2,023
Sq Ft
$701/Sq Ft
Est. Value
About This Home
This home is located at 310 Parker St, Newton Center, MA 02459 and is currently estimated at $1,418,782, approximately $701 per square foot. 310 Parker St is a home located in Middlesex County with nearby schools including Bowen School, Countryside Elementary School, and Charles E Brown Middle School.
Ownership History
Date
Name
Owned For
Owner Type
Purchase Details
Closed on
Aug 12, 2025
Sold by
Reinfeld Sally
Bought by
Sally Reinfeld Lt and Reinfeld
Current Estimated Value
Purchase Details
Closed on
Aug 17, 1999
Sold by
Three Ten Parker Rt and Crowley
Bought by
Reinfeld Sally
Home Financials for this Owner
Home Financials are based on the most recent Mortgage that was taken out on this home.
Original Mortgage
$227,500
Interest Rate
7.65%
Mortgage Type
Purchase Money Mortgage
Create a Home Valuation Report for This Property
The Home Valuation Report is an in-depth analysis detailing your home's value as well as a comparison with similar homes in the area
Home Values in the Area
Average Home Value in this Area
Purchase History
| Date | Buyer | Sale Price | Title Company |
|---|---|---|---|
| Sally Reinfeld Lt | -- | -- | |
| Sally Reinfeld Lt | -- | -- | |
| Reinfeld Sally | $429,000 | -- |
Source: Public Records
Mortgage History
| Date | Status | Borrower | Loan Amount |
|---|---|---|---|
| Previous Owner | Reinfeld Sally | $210,000 | |
| Previous Owner | Reinfeld Sally | $227,500 | |
| Previous Owner | Reinfeld Sally | $80,000 |
Source: Public Records
Tax History Compared to Growth
Tax History
| Year | Tax Paid | Tax Assessment Tax Assessment Total Assessment is a certain percentage of the fair market value that is determined by local assessors to be the total taxable value of land and additions on the property. | Land | Improvement |
|---|---|---|---|---|
| 2025 | $10,156 | $1,036,300 | $876,400 | $159,900 |
| 2024 | $9,820 | $1,006,100 | $850,900 | $155,200 |
| 2023 | $9,310 | $914,500 | $653,800 | $260,700 |
| 2022 | $8,908 | $846,800 | $605,400 | $241,400 |
| 2021 | $8,596 | $798,900 | $571,100 | $227,800 |
| 2020 | $8,341 | $798,900 | $571,100 | $227,800 |
| 2019 | $8,105 | $775,600 | $554,500 | $221,100 |
| 2018 | $7,718 | $713,300 | $502,300 | $211,000 |
| 2017 | $7,483 | $672,900 | $473,900 | $199,000 |
| 2016 | $7,157 | $628,900 | $442,900 | $186,000 |
| 2015 | $6,824 | $587,800 | $413,900 | $173,900 |
Source: Public Records
Map
Nearby Homes