310 Pinto Ct Vallejo, CA 94591
Hunter Ranch NeighborhoodEstimated Value: $662,000 - $764,000
About This Home
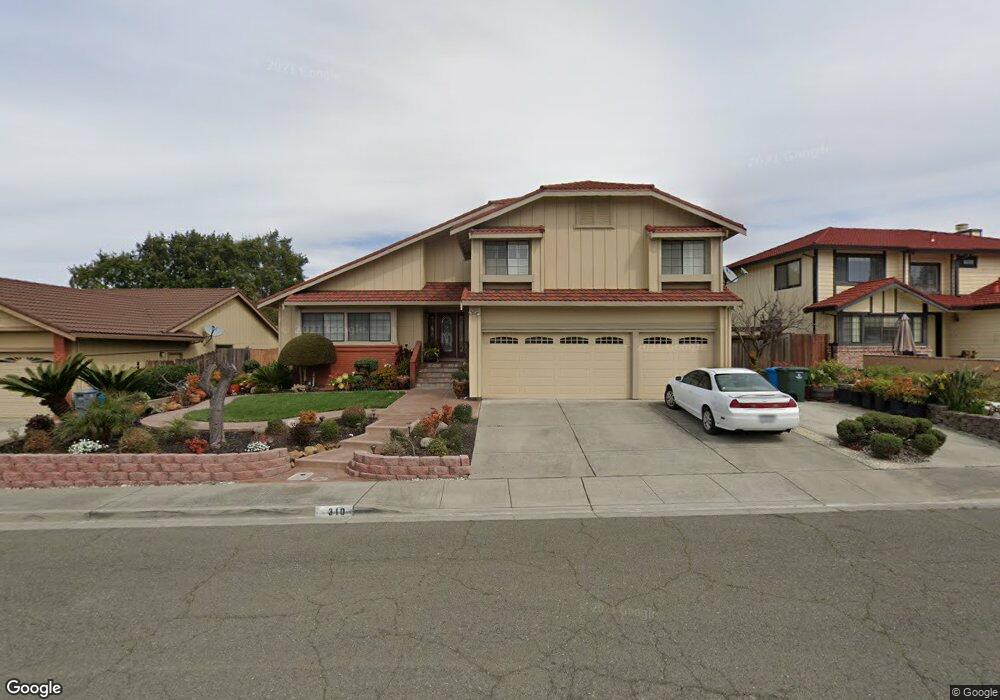
This home is located at 310 Pinto Ct, Vallejo, CA 94591 and is currently estimated at $711,721, approximately $273 per square foot. 310 Pinto Ct is a home located in Solano County with nearby schools including Joseph H. Wardlaw Elementary School, Hogan Middle School, and Jesse M. Bethel High School.
Ownership History
We collect this data history from publicly available records. To have your information removed, we recommend requesting removal directly through your county’s website.
Purchase Details
Purchase Details
Home Financials for this Owner
Home Financials are based on the most recent Mortgage that was taken out on this home.Home Values in the Area
Average Home Value in this Area
Purchase History
We collect this data history from publicly available records. To have your information removed, we recommend requesting removal directly through your county’s website.
| Date | Buyer | Sale Price | Title Company |
|---|---|---|---|
| -- | None Available | ||
| -- | -- |
Mortgage History
We collect this data history from publicly available records. To have your information removed, we recommend requesting removal directly through your county’s website.
| Date | Status | Borrower | Loan Amount |
|---|---|---|---|
| Closed | $250,000 | ||
| Closed | $100,000 |
Tax History
We collect this data history from publicly available records. To have your information removed, we recommend requesting removal directly through your county’s website.
| Year | Tax Paid | Tax Assessment Tax Assessment Total Assessment is a certain percentage of the fair market value that is determined by local assessors to be the total taxable value of land and additions on the property. | Land | Improvement |
|---|---|---|---|---|
| 2025 | $5,215 | $345,311 | $60,934 | $284,377 |
| 2024 | $5,215 | $338,541 | $59,740 | $278,801 |
| 2023 | $4,932 | $331,904 | $58,569 | $273,335 |
| 2022 | $4,999 | $325,397 | $57,421 | $267,976 |
| 2021 | $4,727 | $319,018 | $56,296 | $262,722 |
| 2020 | $4,747 | $315,748 | $55,719 | $260,029 |
| 2019 | $4,609 | $309,558 | $54,627 | $254,931 |
| 2018 | $4,329 | $303,489 | $53,556 | $249,933 |
| 2017 | $4,146 | $297,539 | $52,506 | $245,033 |
| 2016 | $3,661 | $291,706 | $51,477 | $240,229 |
| 2015 | $3,611 | $287,325 | $50,704 | $236,621 |
| 2014 | $3,557 | $281,697 | $49,711 | $231,986 |
Map
- 172 Pinto Dr
- 1402 Legend Cir
- 1466 Legend Cir
- 8605 Fountain Blue Ct Unit 2
- 2163 Garnet Cir
- 8508 Felino Ct
- 289 Reynard Ln
- 8417 Benavente Ct
- 299 Lippizan Dr
- 160 Shetland Ct
- 143 Creekview Dr
- 1146 Waltz Ct
- 1103 Sonata Dr
- 1117 Symphony Way
- 153 Bridlewood Ct
- 9208 Hallmark Place
- 1112 Sonata Dr
- 9212 Hallmark Place
- 1139 Symphony Way
- 9102 Cambridge Cir
Ask me questions while you tour the home.