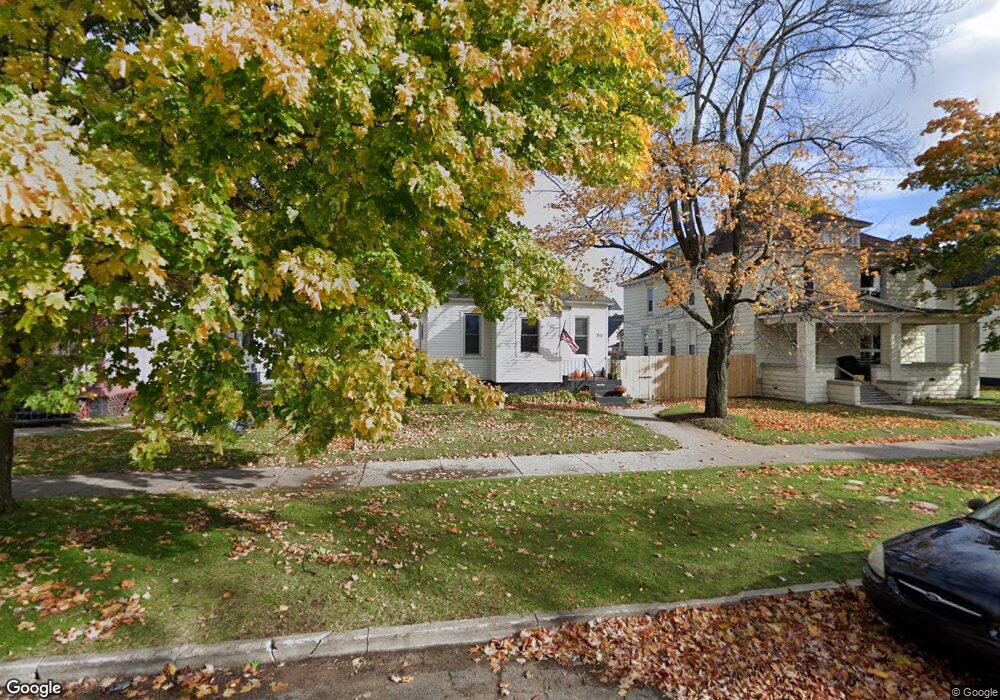
310 S 16th St Escanaba, MI 49829
Estimated Value: $116,000 - $153,000
3
Beds
2
Baths
925
Sq Ft
$139/Sq Ft
Est. Value
About This Home
This home is located at 310 S 16th St, Escanaba, MI 49829 and is currently estimated at $128,346, approximately $138 per square foot. 310 S 16th St is a home located in Delta County with nearby schools including Escanaba Jr./Sr. High School and Holy Name Catholic School.
Ownership History
Date
Name
Owned For
Owner Type
Purchase Details
Closed on
Aug 25, 2006
Sold by
Brandon Brandon
Bought by
Kell Brian R
Current Estimated Value
Home Financials for this Owner
Home Financials are based on the most recent Mortgage that was taken out on this home.
Original Mortgage
$61,000
Outstanding Balance
$36,832
Interest Rate
6.77%
Mortgage Type
Purchase Money Mortgage
Estimated Equity
$91,514
Purchase Details
Closed on
Aug 28, 2002
Bought by
Moraski
Purchase Details
Closed on
Dec 16, 2001
Bought by
Hud
Purchase Details
Closed on
Jul 20, 2001
Bought by
Waterfield
Create a Home Valuation Report for This Property
The Home Valuation Report is an in-depth analysis detailing your home's value as well as a comparison with similar homes in the area
Home Values in the Area
Average Home Value in this Area
Purchase History
| Date | Buyer | Sale Price | Title Company |
|---|---|---|---|
| Kell Brian R | $59,900 | -- | |
| Kell | $59,900 | -- | |
| Moraski | $17,500 | -- | |
| Hud | -- | -- | |
| Waterfield | $33,200 | -- |
Source: Public Records
Mortgage History
| Date | Status | Borrower | Loan Amount |
|---|---|---|---|
| Open | Kell | $61,000 | |
| Closed | Kell | $61,000 |
Source: Public Records
Tax History
| Year | Tax Paid | Tax Assessment Tax Assessment Total Assessment is a certain percentage of the fair market value that is determined by local assessors to be the total taxable value of land and additions on the property. | Land | Improvement |
|---|---|---|---|---|
| 2025 | $988 | $42,300 | $0 | $0 |
| 2024 | $959 | $37,000 | $0 | $0 |
| 2023 | $1,210 | $32,700 | $0 | $0 |
| 2022 | $1,114 | $29,200 | $0 | $0 |
| 2020 | $1,114 | $27,900 | $0 | $0 |
| 2019 | $1,079 | $25,800 | $0 | $0 |
| 2018 | $1,097 | $26,900 | $0 | $0 |
| 2017 | $801 | $26,516 | $0 | $0 |
| 2016 | $1,053 | $27,554 | $0 | $0 |
| 2014 | $767 | $27,028 | $0 | $0 |
| 2013 | $767 | $24,669 | $0 | $0 |
Source: Public Records
Map
Nearby Homes
- 105 N 19th St
- 1114 1st Ave S
- 219 N 20th St
- 206 N 21st
- 509 S 10th St
- 113 S 10th St
- 910 13th St S
- 1524 9th Ave S
- 1824 9th Ave S
- 517 S 9th St
- 1020 S 18th St
- 417 S 8th St
- 2414 Ludington St
- 804 S 13th St
- 314 S 6th St
- 605 Ogden Ave
- 1930 S 22nd St
- 200 Ludington Unit 12 St Unit 12
- 200 Ludington Unit 5 St Unit 5
- 200 Ludington Unit 9 St Unit 9
Your Personal Tour Guide
Ask me questions while you tour the home.