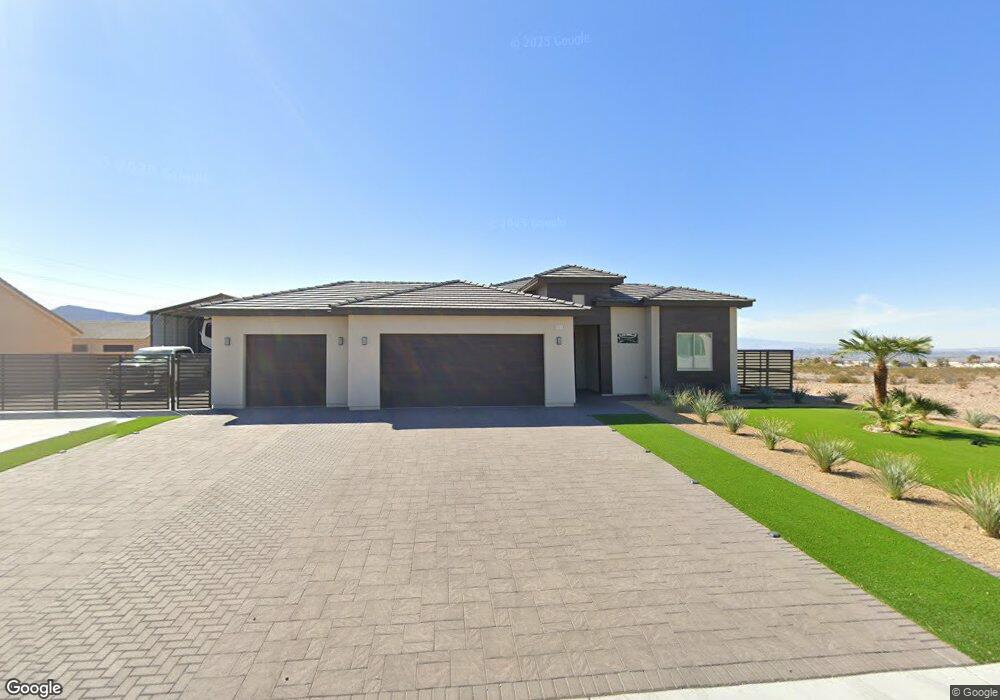
310 S Milan St Henderson, NV 89015
Foothills NeighborhoodEstimated Value: $588,000 - $906,465
3
Beds
3
Baths
2,403
Sq Ft
$307/Sq Ft
Est. Value
About This Home
This home is located at 310 S Milan St, Henderson, NV 89015 and is currently estimated at $737,366, approximately $306 per square foot. 310 S Milan St is a home with nearby schools including Sue H. Morrow Elementary School, B Mahlon Brown Academy of International Studies, and Basic Academy of International Studies.
Ownership History
Date
Name
Owned For
Owner Type
Purchase Details
Closed on
Jan 15, 2020
Sold by
Crc Properties Llc
Bought by
Welch Darryl
Current Estimated Value
Purchase Details
Closed on
Feb 4, 2019
Sold by
Compton Lester Edmond
Bought by
Crc Properties Llc
Purchase Details
Closed on
Sep 5, 2001
Sold by
Dill Angela
Bought by
Compton Lester Edmond
Purchase Details
Closed on
May 8, 2000
Sold by
Eccleston R C
Bought by
Dill Angela
Home Financials for this Owner
Home Financials are based on the most recent Mortgage that was taken out on this home.
Original Mortgage
$29,000
Interest Rate
8.27%
Mortgage Type
Purchase Money Mortgage
Purchase Details
Closed on
Dec 16, 1999
Sold by
Eccleston Trudy
Bought by
Eccleston R C
Purchase Details
Closed on
Nov 18, 1999
Sold by
Adkins Dean and Adkins Debra Richburg
Bought by
Eccleston R C
Create a Home Valuation Report for This Property
The Home Valuation Report is an in-depth analysis detailing your home's value as well as a comparison with similar homes in the area
Home Values in the Area
Average Home Value in this Area
Purchase History
| Date | Buyer | Sale Price | Title Company |
|---|---|---|---|
| Welch Darryl | $110,000 | Ticor Title Henderson | |
| Crc Properties Llc | $110,000 | Ticor Title Henderson | |
| Compton Lester Edmond | $52,000 | United Title | |
| Dill Angela | $50,000 | United Title | |
| Eccleston R C | -- | Land Title | |
| Eccleston R C | $9,854 | Land Title |
Source: Public Records
Mortgage History
| Date | Status | Borrower | Loan Amount |
|---|---|---|---|
| Previous Owner | Dill Angela | $29,000 | |
| Closed | Dill Angela | $20,460 |
Source: Public Records
Tax History Compared to Growth
Tax History
| Year | Tax Paid | Tax Assessment Tax Assessment Total Assessment is a certain percentage of the fair market value that is determined by local assessors to be the total taxable value of land and additions on the property. | Land | Improvement |
|---|---|---|---|---|
| 2025 | $7,698 | $293,817 | $63,000 | $230,817 |
| 2024 | $7,128 | $293,817 | $63,000 | $230,817 |
| 2023 | $7,128 | $269,390 | $56,000 | $213,390 |
| 2022 | $6,083 | $225,162 | $49,000 | $176,162 |
| 2021 | $5,632 | $146,902 | $45,500 | $101,402 |
| 2020 | $627 | $47,250 | $47,250 | $0 |
| 2019 | $588 | $40,250 | $40,250 | $0 |
| 2018 | $561 | $26,250 | $26,250 | $0 |
| 2017 | $710 | $24,500 | $24,500 | $0 |
| 2016 | $526 | $24,500 | $24,500 | $0 |
| 2015 | $524 | $17,500 | $17,500 | $0 |
| 2014 | $507 | $17,500 | $17,500 | $0 |
Source: Public Records
Map
Nearby Homes
- 328 S Milan St
- 332 Milan St
- Everett Plan at Montview Estates
- 1029 Venice Ave
- Spring Plan at Montview Estates
- Dawson Plan at Montview Estates
- 315 S Lisbon St
- 343 Milan St
- 312 S Parawan St
- Everett Plan at Westview Estates
- Willow Plan at Westview Estates
- Dawson Plan at Westview Estates
- 329 Blossom Wind St
- 312 Parawan St
- 0 Burkholder Unit 2721538
- 0 Burkholder & Magic Unit 2727316
- 198 S Orleans St
- 321 Blossom Wind St
- 365 Shimmering Moon St
- 368 Misty Moonlight St
- 320 S Milan St
- 325 S Milan St
- 320 S Lisbon St
- 321 S Lisbon St
- 337 S Milan St
- 337 S Milan St Unit Lot 2
- 311 S Lisbon St
- 0 S Lisbon St
- 325 S Lisbon St
- 320 Gusty Sands St
- 328 S Lisbon St
- 270 N Naples St
- 339 Milan St
- 329 S Lisbon St
- 270 S Naples St
- 324 Gusty Sands St
- 332 S Lisbon St Unit Lot 55
- 338 S Milan St
- 0 Toronto Ave
- 341 S Milan St