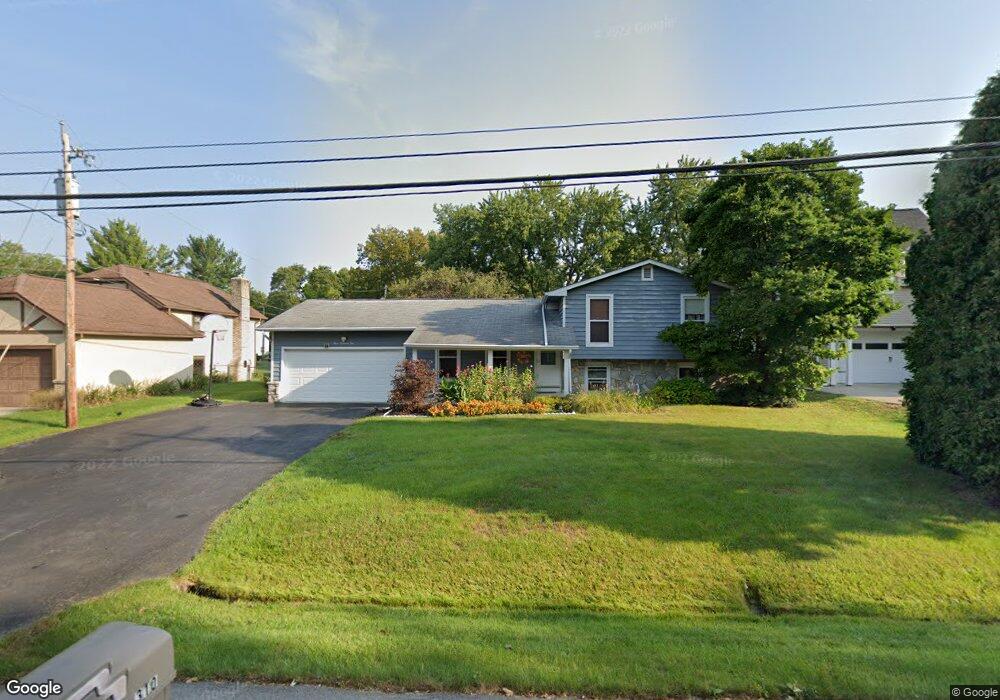
310 Schrock Rd Worthington, OH 43085
Estimated Value: $419,000 - $479,000
3
Beds
2
Baths
1,720
Sq Ft
$257/Sq Ft
Est. Value
About This Home
This home is located at 310 Schrock Rd, Worthington, OH 43085 and is currently estimated at $442,213, approximately $257 per square foot. 310 Schrock Rd is a home located in Franklin County with nearby schools including Wilson Hill Elementary School, Kilbourne Middle School, and Thomas Worthington High School.
Ownership History
Date
Name
Owned For
Owner Type
Purchase Details
Closed on
Jul 14, 2003
Sold by
Marsch James Jack and Marsch Jill E
Bought by
Schroeder James J and Schroeder Carol A
Current Estimated Value
Home Financials for this Owner
Home Financials are based on the most recent Mortgage that was taken out on this home.
Original Mortgage
$101,000
Outstanding Balance
$43,070
Interest Rate
5.3%
Mortgage Type
Purchase Money Mortgage
Estimated Equity
$399,143
Purchase Details
Closed on
Nov 3, 1995
Sold by
Boyer Theodore R
Bought by
Marsch James J and Marsch Jill E
Home Financials for this Owner
Home Financials are based on the most recent Mortgage that was taken out on this home.
Original Mortgage
$116,350
Interest Rate
7.61%
Mortgage Type
New Conventional
Create a Home Valuation Report for This Property
The Home Valuation Report is an in-depth analysis detailing your home's value as well as a comparison with similar homes in the area
Home Values in the Area
Average Home Value in this Area
Purchase History
| Date | Buyer | Sale Price | Title Company |
|---|---|---|---|
| Schroeder James J | $187,100 | Chicago Title | |
| Marsch James J | $122,500 | -- |
Source: Public Records
Mortgage History
| Date | Status | Borrower | Loan Amount |
|---|---|---|---|
| Open | Schroeder James J | $101,000 | |
| Previous Owner | Marsch James J | $116,350 |
Source: Public Records
Tax History Compared to Growth
Tax History
| Year | Tax Paid | Tax Assessment Tax Assessment Total Assessment is a certain percentage of the fair market value that is determined by local assessors to be the total taxable value of land and additions on the property. | Land | Improvement |
|---|---|---|---|---|
| 2024 | $7,692 | $121,210 | $44,310 | $76,900 |
| 2023 | $7,366 | $121,205 | $44,310 | $76,895 |
| 2022 | $6,535 | $85,930 | $35,280 | $50,650 |
| 2021 | $6,043 | $85,930 | $35,280 | $50,650 |
| 2020 | $5,827 | $85,930 | $35,280 | $50,650 |
| 2019 | $5,596 | $74,690 | $35,280 | $39,410 |
| 2018 | $5,024 | $74,690 | $35,280 | $39,410 |
| 2017 | $4,826 | $74,690 | $35,280 | $39,410 |
| 2016 | $4,621 | $63,250 | $18,340 | $44,910 |
| 2015 | $4,622 | $63,250 | $18,340 | $44,910 |
| 2014 | $4,620 | $63,250 | $18,340 | $44,910 |
| 2013 | $2,267 | $62,370 | $17,465 | $44,905 |
Source: Public Records
Map
Nearby Homes
- 6750 Worthington Galena Rd
- 6730 Kensington Way
- 127 Heischman Ave
- 251 Northigh Dr
- 0 Proprietors Rd Unit 225002452
- 463 E North St Unit D-5
- 66 Glen Dr
- 930 Proprietors Rd
- 188 E Clearview Ave
- 6813 Hayhurst St
- 120 Caren Ave
- 675 Plymouth St
- 264 E South St
- 519 Pincherry Ln
- 6165 Northgap Dr
- 477 Olenwood Ave
- 551 Oxford St
- 503 Meadoway Park
- 940 Larkfield Dr
- 554 Haymore Ave N
- 322 Schrock Rd
- 300 Schrock Rd
- 335 Eastworth Way
- 290 Schrock Rd
- 333 Eastworth Way
- 295 Schrock Rd
- 0 Schrock Rd
- 305 W Schrock Rd
- 307 W Schrock Rd
- 303 Schrock Rd
- 293 Schrock Rd Unit 295
- 301 Schrock Rd Unit 303
- 311 Schrock Rd
- 283 Schrock Rd Unit 285
- 307 Schrock Rd Unit 307
- 309 Schrock Rd
- 278 Schrock Rd
- 305 Schrock Rd
- 301 311 Schrock Rd
- 6726 Worthington Galena Rd