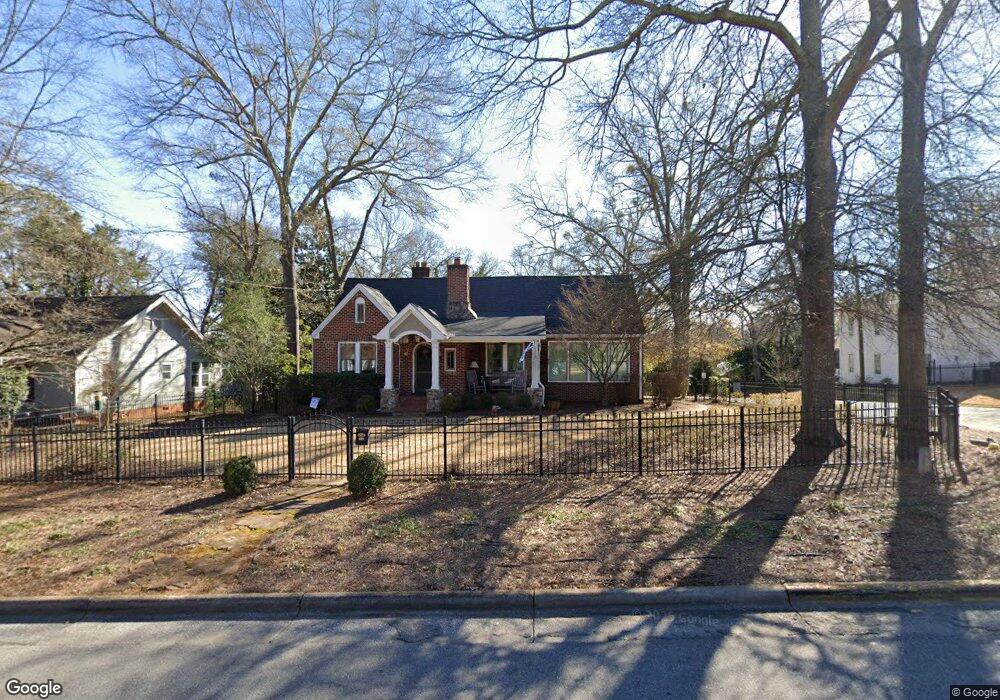
310 Southview Dr Athens, GA 30605
Five Points NeighborhoodEstimated Value: $1,092,000 - $1,727,000
4
Beds
3
Baths
3,543
Sq Ft
$402/Sq Ft
Est. Value
About This Home
This home is located at 310 Southview Dr, Athens, GA 30605 and is currently estimated at $1,425,650, approximately $402 per square foot. 310 Southview Dr is a home located in Clarke County with nearby schools including Barrow Elementary School, Clarke Middle School, and Clarke Central High School.
Ownership History
Date
Name
Owned For
Owner Type
Purchase Details
Closed on
Nov 18, 2011
Sold by
Traditional Southern Homes
Bought by
Slonaker Mark W
Current Estimated Value
Home Financials for this Owner
Home Financials are based on the most recent Mortgage that was taken out on this home.
Original Mortgage
$368,050
Outstanding Balance
$34,945
Interest Rate
4.17%
Mortgage Type
New Conventional
Estimated Equity
$1,390,705
Purchase Details
Closed on
Jan 14, 2009
Sold by
Kerr Dana Andrew
Bought by
Traditional Southern Homes
Home Financials for this Owner
Home Financials are based on the most recent Mortgage that was taken out on this home.
Original Mortgage
$328,000
Interest Rate
5.24%
Mortgage Type
New Conventional
Purchase Details
Closed on
Jan 29, 2004
Sold by
Seawell Lee Anne
Bought by
Kerr Dana Anderson and Kerr Jodi D
Create a Home Valuation Report for This Property
The Home Valuation Report is an in-depth analysis detailing your home's value as well as a comparison with similar homes in the area
Home Values in the Area
Average Home Value in this Area
Purchase History
| Date | Buyer | Sale Price | Title Company |
|---|---|---|---|
| Slonaker Mark W | $433,000 | -- | |
| Traditional Southern Homes | $405,000 | -- | |
| Kerr Dana Anderson | $283,800 | -- |
Source: Public Records
Mortgage History
| Date | Status | Borrower | Loan Amount |
|---|---|---|---|
| Open | Traditional Southern Homes | $368,050 | |
| Previous Owner | Traditional Southern Homes | $328,000 |
Source: Public Records
Tax History
| Year | Tax Paid | Tax Assessment Tax Assessment Total Assessment is a certain percentage of the fair market value that is determined by local assessors to be the total taxable value of land and additions on the property. | Land | Improvement |
|---|---|---|---|---|
| 2025 | $12,365 | $570,031 | $70,000 | $500,031 |
| 2024 | $12,365 | $504,042 | $70,000 | $434,042 |
| 2023 | $12,461 | $453,266 | $70,000 | $383,266 |
| 2022 | $11,024 | $355,576 | $60,000 | $295,576 |
| 2021 | $10,299 | $315,596 | $60,000 | $255,596 |
| 2020 | $10,204 | $312,780 | $60,000 | $252,780 |
| 2019 | $9,171 | $280,128 | $60,000 | $220,128 |
| 2018 | $7,763 | $238,659 | $54,000 | $184,659 |
| 2017 | $7,343 | $226,274 | $54,000 | $172,274 |
| 2016 | $6,349 | $196,998 | $54,000 | $142,998 |
| 2015 | $6,184 | $191,872 | $50,000 | $141,872 |
| 2014 | $5,663 | $176,302 | $44,000 | $132,302 |
Source: Public Records
Map
Nearby Homes
- 293 Southview Dr
- 145 Riverdale Dr
- 1697 S Milledge Ave
- 183 Parkway Dr
- 760 E Campus Rd Unit 95
- 655 E Campus Rd Unit 33
- 655 E Campus Rd
- 655 E Campus Rd Unit 12
- 115 Annes Ct
- 150 Gran Ellen Dr
- 1775 S Milledge Ave Unit 15
- 301 Parkway Dr
- 170 Northview Dr Unit 5
- 230 Milledge Terrace
- 128 Habersham Dr
- 390 Milledge Terrace
- 173 Westview Dr
- 1554 S Lumpkin St Unit 4
- 1554 S Lumpkin St Unit 6
- 1554 S Lumpkin St Unit 5
- 320 Southview Dr
- 282 Southview Dr
- 623 Pinecrest Dr
- 330 Southview Dr
- 620 Pinecrest Dr
- 623 Pinecrest Dr
- 625 Pinecrest Dr
- 623 - 625 Pinecrest Dr
- 629 Pinecrest Dr
- 305 Southview Dr
- 340 Southview Dr
- 272 Southview Dr
- 630 Pinecrest Dr
- 315 Southview Dr
- 117 Hardin Dr
- 325 Southview Dr
- 350 Southview Dr
- 260 Southview Dr
- 597 Pinecrest Dr
- 275 Southview Dr
Your Personal Tour Guide
Ask me questions while you tour the home.