310 Vandiver Ct Canton, GA 30115
Estimated Value: $803,295 - $848,000
5
Beds
4
Baths
3,008
Sq Ft
$274/Sq Ft
Est. Value
About This Home
This home is located at 310 Vandiver Ct, Canton, GA 30115 and is currently estimated at $825,648, approximately $274 per square foot. 310 Vandiver Ct is a home located in Cherokee County with nearby schools including Avery Elementary School, Creekland Middle School, and Creekview High School.
Ownership History
Date
Name
Owned For
Owner Type
Purchase Details
Closed on
Dec 10, 2021
Sold by
Cook James Lee
Bought by
Gamble Laura Beth and Gamble Thomas
Current Estimated Value
Home Financials for this Owner
Home Financials are based on the most recent Mortgage that was taken out on this home.
Original Mortgage
$540,000
Outstanding Balance
$495,788
Interest Rate
2.98%
Mortgage Type
New Conventional
Estimated Equity
$329,860
Purchase Details
Closed on
Oct 9, 2020
Sold by
Ahmed Perveen
Bought by
Cook James Lee and Cook Therese M
Home Financials for this Owner
Home Financials are based on the most recent Mortgage that was taken out on this home.
Original Mortgage
$52,500
Interest Rate
2.8%
Mortgage Type
Commercial
Purchase Details
Closed on
Jan 5, 2012
Sold by
Pltp Holdings Llc
Bought by
Vineyard Investors Llc
Purchase Details
Closed on
Nov 3, 2011
Sold by
Crm Central Properties Llc
Bought by
Pltp Holdings Llc
Create a Home Valuation Report for This Property
The Home Valuation Report is an in-depth analysis detailing your home's value as well as a comparison with similar homes in the area
Home Values in the Area
Average Home Value in this Area
Purchase History
| Date | Buyer | Sale Price | Title Company |
|---|---|---|---|
| Gamble Laura Beth | $675,000 | -- | |
| Cook James Lee | $75,000 | -- | |
| Vineyard Investors Llc | -- | -- | |
| Pltp Holdings Llc | $7,500 | -- |
Source: Public Records
Mortgage History
| Date | Status | Borrower | Loan Amount |
|---|---|---|---|
| Open | Gamble Laura Beth | $540,000 | |
| Previous Owner | Cook James Lee | $52,500 |
Source: Public Records
Tax History Compared to Growth
Tax History
| Year | Tax Paid | Tax Assessment Tax Assessment Total Assessment is a certain percentage of the fair market value that is determined by local assessors to be the total taxable value of land and additions on the property. | Land | Improvement |
|---|---|---|---|---|
| 2024 | $4,257 | $317,400 | $59,200 | $258,200 |
| 2023 | $4,331 | $311,360 | $56,000 | $255,360 |
| 2022 | $3,152 | $242,920 | $46,000 | $196,920 |
| 2021 | $852 | $30,000 | $30,000 | $0 |
| 2020 | $909 | $32,000 | $32,000 | $0 |
| 2019 | $909 | $32,000 | $32,000 | $0 |
| 2018 | $961 | $33,600 | $33,600 | $0 |
| 2017 | $864 | $75,000 | $30,000 | $0 |
| 2016 | $326 | $28,000 | $11,200 | $0 |
| 2015 | $329 | $28,000 | $11,200 | $0 |
| 2014 | $161 | $13,700 | $5,480 | $0 |
Source: Public Records
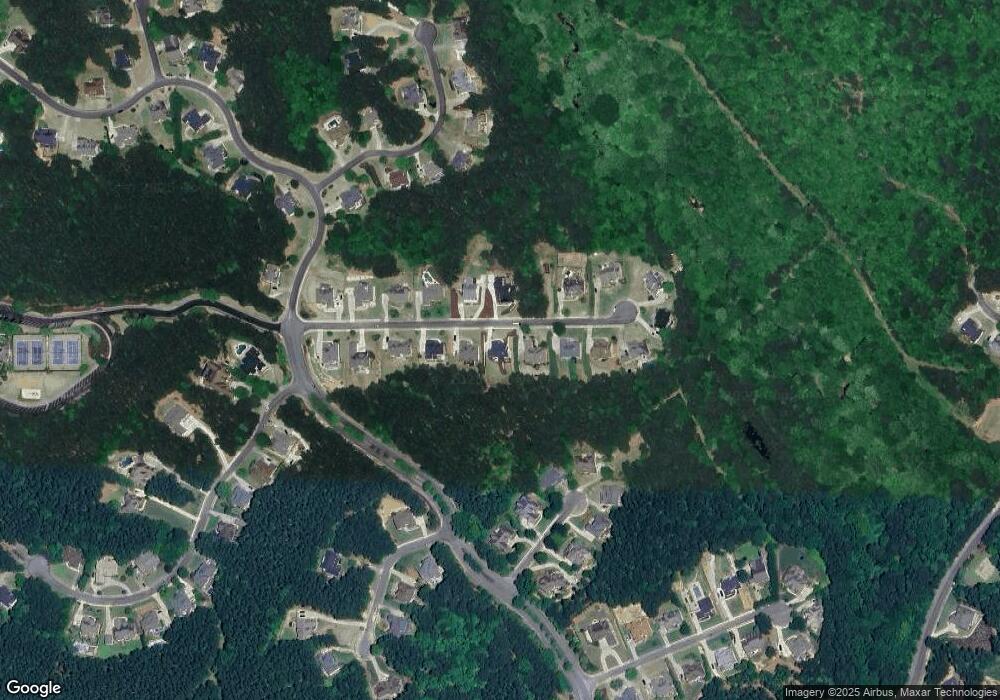
Map
Nearby Homes
- 0 Harmony Dr Unit 7532369
- 0 Harmony Dr Unit 10468292
- 729 Conley Dr
- 714 Conley Dr
- 716 Conley Dr
- 302 Gilmer Ct
- 122 Griffin Way
- Leland Plan at Governor’s Preserve - Masterpiece Collection
- Margot Plan at Governor’s Preserve - Masterpiece Collection
- Paxton Plan at Governor’s Preserve - Masterpiece Collection
- Winslow Plan at Governor’s Preserve - Masterpiece Collection
- Pearson Plan at Governor’s Preserve - Masterpiece Collection
- Grayson Plan at Governor’s Preserve - Masterpiece Collection
- Rhodes Plan at Governor’s Preserve - Masterpiece Collection
- 131 Griffin Way
- 608 Walker Ct
- 212 Schley Trail
- 2118 Harmony Dr
- 510 Perdue Trail
- 2121 Harmony Dr
- 310 Vandiver Ct
- 308 Vandiver Ct
- 312 Vandiver Ct Unit 6
- 0 Vandiver Ct Unit 3282852
- 0 Vandiver Ct Unit 3243012
- 0 Vandiver Ct Unit 3243010
- 0 Vandiver Ct Unit 8854471
- 0 Vandiver Ct Unit 8298872
- 0 Vandiver Ct Unit 8304589
- 0 Vandiver Ct Unit 8207015
- 0 Vandiver Ct Unit 7468090
- 0 Vandiver Ct Unit 7261678
- 0 Vandiver Ct Unit 8827216
- 0 Vandiver Ct Unit 8791860
- 0 Vandiver Ct Unit 7586412
- 0 Vandiver Ct
- 309 Vandiver Ct
- 313 Vandiver Ct
- 306 Vandiver Ct
- 314 Vandiver Ct