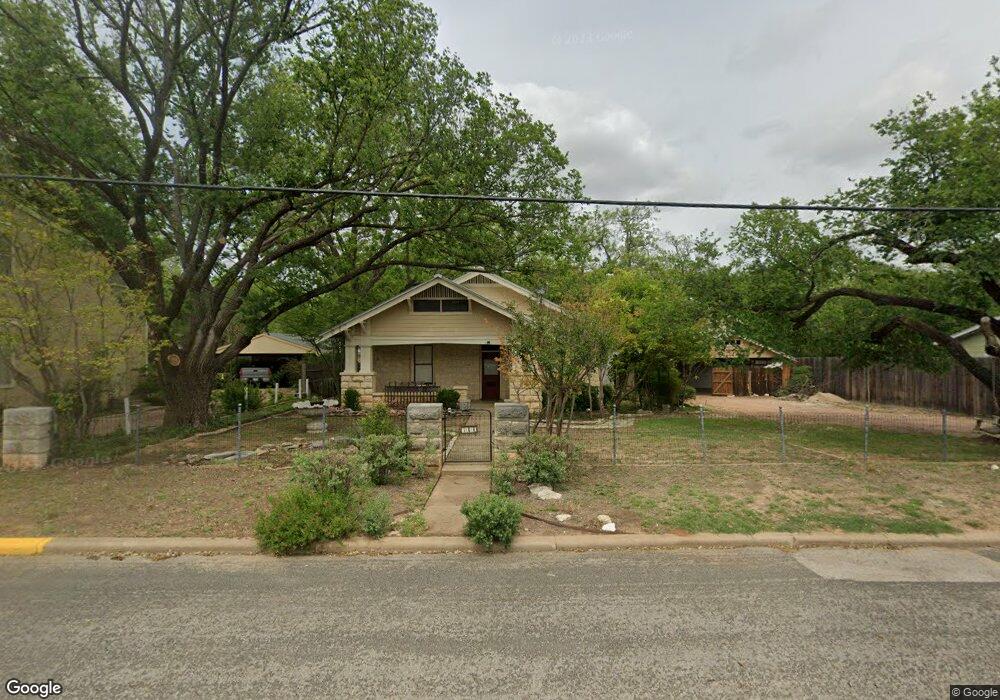
310 W Austin St Fredericksburg, TX 78624
Estimated Value: $293,199 - $651,000
2
Beds
3
Baths
1,462
Sq Ft
$316/Sq Ft
Est. Value
About This Home
This home is located at 310 W Austin St, Fredericksburg, TX 78624 and is currently estimated at $461,550, approximately $315 per square foot. 310 W Austin St is a home located in Gillespie County with nearby schools including Fredericksburg High School, St. Mary's Catholic School, and Ambleside School of Fredericksburg.
Create a Home Valuation Report for This Property
The Home Valuation Report is an in-depth analysis detailing your home's value as well as a comparison with similar homes in the area
Home Values in the Area
Average Home Value in this Area
Tax History Compared to Growth
Tax History
| Year | Tax Paid | Tax Assessment Tax Assessment Total Assessment is a certain percentage of the fair market value that is determined by local assessors to be the total taxable value of land and additions on the property. | Land | Improvement |
|---|---|---|---|---|
| 2025 | $3,535 | $282,362 | $101,910 | $180,452 |
| 2024 | $3,535 | $279,248 | $101,910 | $177,338 |
| 2023 | $3,421 | $279,248 | $101,910 | $177,338 |
| 2022 | $3,595 | $240,523 | $78,729 | $161,794 |
| 2021 | $3,486 | $206,663 | $61,181 | $145,482 |
| 2020 | $2,817 | $180,629 | $57,541 | $123,088 |
| 2019 | $2,721 | $180,629 | $57,541 | $123,088 |
| 2018 | $2,500 | $157,141 | $45,495 | $111,646 |
| 2017 | $2,399 | $143,489 | $38,996 | $104,493 |
| 2016 | $2,134 | $124,977 | $30,330 | $94,647 |
| 2015 | -- | $121,618 | $30,330 | $91,288 |
| 2014 | -- | $97,247 | $17,332 | $79,915 |
Source: Public Records
Map
Nearby Homes
- 303 W Austin St
- Lot 5 N Longview Dr
- Tract 5 Ranch Road 965 Unit 5
- 14087 Ranch Road 965
- 3366 Ranch Road 965
- 213 Mistletoe St
- 408 W Main St
- Lot 69 Oakwater Dr Unit 69
- 207 Mistletoe St
- 403 N Pecan St
- 203 W Travis St
- 405 N Pecan St
- 320 W Orchard St
- 4392 Fm 2721
- lot 7 N Longview Dr Unit 7
- 30 Sutton Dr
- TBD Herbert Schaefer Rd
- 514 W Austin St
- 114 W Austin St Unit 379
- 509 W Austin St
- 310 W Austin St
- 308 W Austin St
- 312 W Austin St
- 203 N Milam St
- 201 N Milam St
- 205 N Milam St
- 207 N Milam St
- 311 W Austin St
- 300 W Austin St
- 309 W Austin St
- 302 W Austin St
- 313 W Austin St
- 109 N Milam St
- 315 W Austin St
- 303 W Schubert St
- 303 -R W Austin St
- 307 W Schubert St
- 105 N Milam St
- 309 W Schubert St
- 204 N Orange St