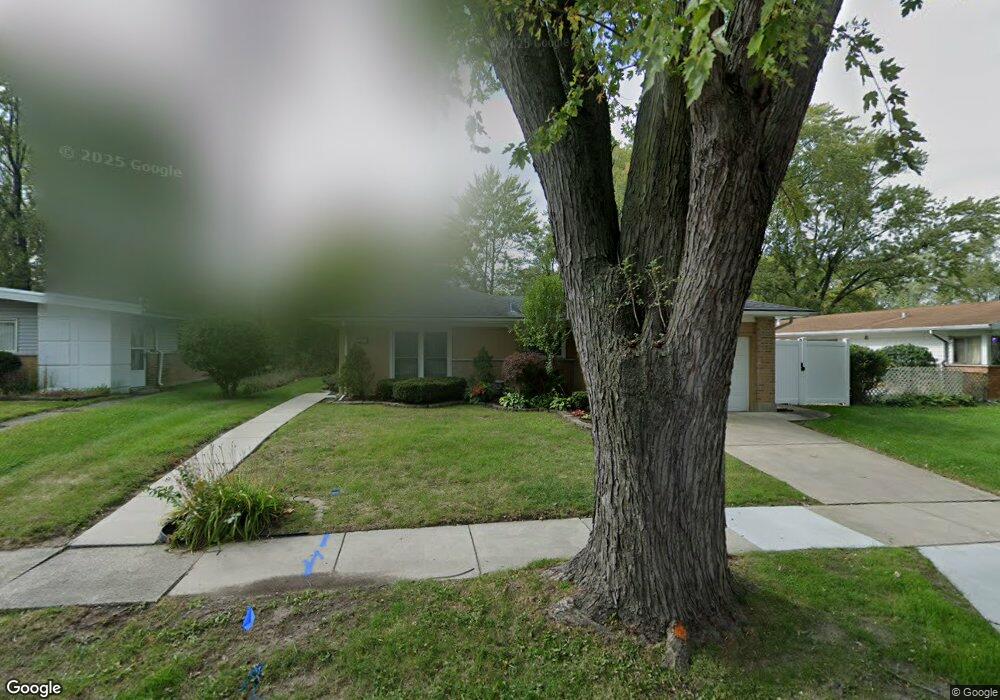
310 Windsor St Park Forest, IL 60466
Estimated Value: $147,075 - $172,000
3
Beds
1
Bath
1,142
Sq Ft
$141/Sq Ft
Est. Value
About This Home
This home is located at 310 Windsor St, Park Forest, IL 60466 and is currently estimated at $160,519, approximately $140 per square foot. 310 Windsor St is a home located in Cook County with nearby schools including Michelle Obama School of Technology, Mohawk Primary Center, and Barack Obama School of Leadership and STEM.
Ownership History
Date
Name
Owned For
Owner Type
Purchase Details
Closed on
Feb 19, 2010
Sold by
Gayle Christine
Bought by
Glenn Donna M and Gayle Christine
Current Estimated Value
Purchase Details
Closed on
Jan 25, 2008
Sold by
Charon Brant E
Bought by
Gayle Christine
Home Financials for this Owner
Home Financials are based on the most recent Mortgage that was taken out on this home.
Original Mortgage
$102,400
Outstanding Balance
$64,760
Interest Rate
6.11%
Mortgage Type
Unknown
Estimated Equity
$95,759
Purchase Details
Closed on
Mar 29, 2005
Sold by
Weiss Sheldon A and Weiss Kathy J
Bought by
Charon Brant E
Home Financials for this Owner
Home Financials are based on the most recent Mortgage that was taken out on this home.
Original Mortgage
$102,083
Interest Rate
5.64%
Mortgage Type
FHA
Create a Home Valuation Report for This Property
The Home Valuation Report is an in-depth analysis detailing your home's value as well as a comparison with similar homes in the area
Home Values in the Area
Average Home Value in this Area
Purchase History
| Date | Buyer | Sale Price | Title Company |
|---|---|---|---|
| Glenn Donna M | -- | None Available | |
| Gayle Christine | $128,000 | Chicago Title Insurance Co | |
| Charon Brant E | $103,000 | First American Title |
Source: Public Records
Mortgage History
| Date | Status | Borrower | Loan Amount |
|---|---|---|---|
| Open | Gayle Christine | $102,400 | |
| Previous Owner | Charon Brant E | $102,083 |
Source: Public Records
Tax History Compared to Growth
Tax History
| Year | Tax Paid | Tax Assessment Tax Assessment Total Assessment is a certain percentage of the fair market value that is determined by local assessors to be the total taxable value of land and additions on the property. | Land | Improvement |
|---|---|---|---|---|
| 2024 | $6,191 | $10,617 | $2,520 | $8,097 |
| 2023 | $3,150 | $11,773 | $2,520 | $9,253 |
| 2022 | $3,150 | $5,764 | $2,340 | $3,424 |
| 2021 | $3,210 | $5,763 | $2,340 | $3,423 |
| 2020 | $3,201 | $5,763 | $2,340 | $3,423 |
| 2019 | $2,894 | $6,088 | $2,160 | $3,928 |
| 2018 | $3,022 | $6,316 | $2,160 | $4,156 |
| 2017 | $3,066 | $6,316 | $2,160 | $4,156 |
| 2016 | $3,110 | $5,625 | $1,980 | $3,645 |
| 2015 | $2,916 | $5,625 | $1,980 | $3,645 |
| 2014 | $2,882 | $5,625 | $1,980 | $3,645 |
| 2013 | $3,561 | $6,845 | $1,980 | $4,865 |
Source: Public Records
Map
Nearby Homes