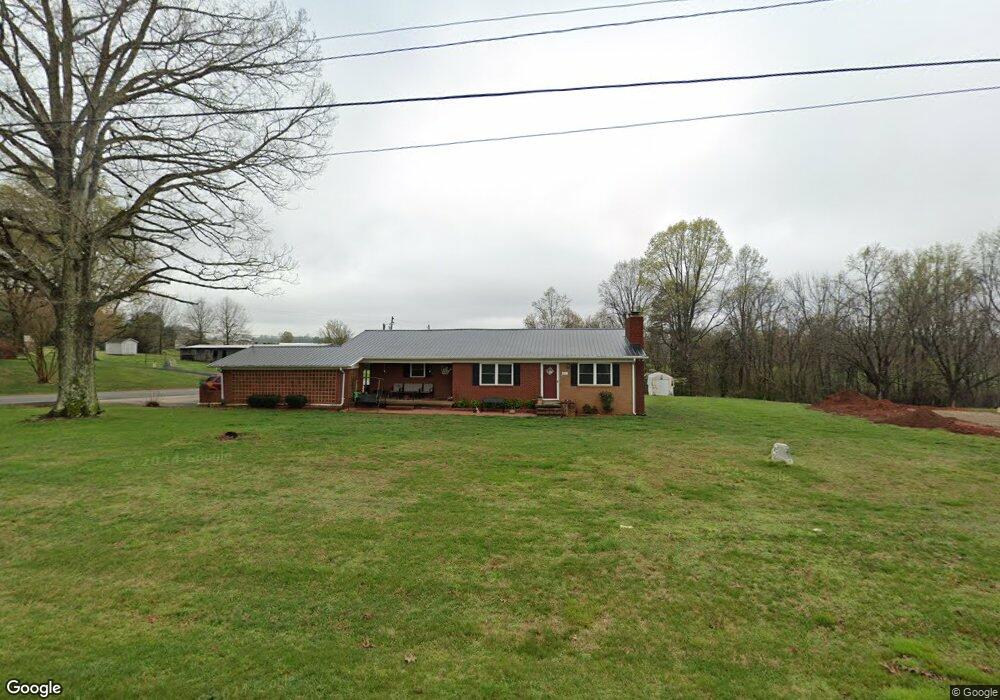
3100 Miller Rd Salisbury, NC 28147
Estimated Value: $315,588 - $396,000
--
Bed
2
Baths
1,799
Sq Ft
$199/Sq Ft
Est. Value
About This Home
This home is located at 3100 Miller Rd, Salisbury, NC 28147 and is currently estimated at $358,647, approximately $199 per square foot. 3100 Miller Rd is a home located in Rowan County with nearby schools including Millbridge Elementary School, Southeast Middle School, and West Rowan High School.
Ownership History
Date
Name
Owned For
Owner Type
Purchase Details
Closed on
Dec 1, 2020
Sold by
Alley Spring Carter and Alley Wayne K
Bought by
Alley Spring Carter and Alley Wayne K
Current Estimated Value
Home Financials for this Owner
Home Financials are based on the most recent Mortgage that was taken out on this home.
Original Mortgage
$42,800
Outstanding Balance
$38,173
Interest Rate
2.8%
Mortgage Type
New Conventional
Estimated Equity
$320,474
Purchase Details
Closed on
Oct 23, 2008
Sold by
Fink Sonya C and Fink Thomas E
Bought by
Bame Spring C
Home Financials for this Owner
Home Financials are based on the most recent Mortgage that was taken out on this home.
Original Mortgage
$75,937
Interest Rate
5.78%
Mortgage Type
FHA
Purchase Details
Closed on
Sep 6, 2005
Sold by
Fink Sonya C and Carter Glenn Hayden
Bought by
Fink Sonya C and Bame Spring C
Create a Home Valuation Report for This Property
The Home Valuation Report is an in-depth analysis detailing your home's value as well as a comparison with similar homes in the area
Home Values in the Area
Average Home Value in this Area
Purchase History
| Date | Buyer | Sale Price | Title Company |
|---|---|---|---|
| Alley Spring Carter | -- | None Available | |
| Alley Spring Carter | -- | None Listed On Document | |
| Bame Spring C | -- | None Available | |
| Fink Sonya C | -- | -- |
Source: Public Records
Mortgage History
| Date | Status | Borrower | Loan Amount |
|---|---|---|---|
| Open | Alley Spring Carter | $42,800 | |
| Closed | Alley Spring Carter | $42,800 | |
| Previous Owner | Bame Spring C | $75,937 |
Source: Public Records
Tax History Compared to Growth
Tax History
| Year | Tax Paid | Tax Assessment Tax Assessment Total Assessment is a certain percentage of the fair market value that is determined by local assessors to be the total taxable value of land and additions on the property. | Land | Improvement |
|---|---|---|---|---|
| 2025 | $1,643 | $242,492 | $36,570 | $205,922 |
| 2024 | $1,643 | $242,492 | $36,570 | $205,922 |
| 2023 | $1,643 | $242,492 | $36,570 | $205,922 |
| 2022 | $1,064 | $140,990 | $28,090 | $112,900 |
| 2021 | $1,054 | $140,990 | $28,090 | $112,900 |
| 2020 | $1,054 | $140,990 | $28,090 | $112,900 |
| 2019 | $1,054 | $140,990 | $28,090 | $112,900 |
| 2018 | $873 | $117,752 | $28,090 | $89,662 |
| 2017 | $873 | $117,752 | $28,090 | $89,662 |
| 2016 | $873 | $117,752 | $28,090 | $89,662 |
| 2015 | $879 | $117,190 | $28,090 | $89,100 |
| 2014 | $867 | $121,202 | $28,090 | $93,112 |
Source: Public Records
Map
Nearby Homes
- 260 Cress School Rd
- 2740 Hill Top Dr
- 462 Cress Loop Rd
- 328 Bramblewood Dr
- 3080 Shue Rd
- 130 Lois Ln
- 155 Putney Ct
- 1348 Greenheather Dr
- 110 Venture Dr
- 215 Autumn Chapel Dr
- 0 Patrick Dr
- 1213 Stonegate Dr
- 1340 Coppergate Dr
- 1370 Coppergate Dr
- 1355 Coppergate Dr
- Azalea II Plan at Yorkshire Farms
- Daffodil Plan at Yorkshire Farms
- 203 Trinity Ct
- 4860 Patterson Rd
- 611 Davis Farm Dr
- 3140 Miller Rd
- 3090 Miller Rd
- 01028 Archer Acres Dr
- 3015 Miller Rd
- 00002 Cooper Rd
- 3168 Miller Rd
- 2975 Miller Rd
- 3025 Miller Rd
- 2960 Miller Rd
- 305 Cooper Rd
- 3170 Miller Rd
- 2955 Miller Rd
- 2930 Miller Rd
- 395 Cooper Rd
- 3255 Miller Rd
- 2915 Miller Rd
- 2880 Miller Rd
- 2985 Miller Rd
- 375 Cooper Rd
- 3345 Miller Rd