3100 NE Wheeler St Poulsbo, WA 98370
Estimated Value: $575,000 - $707,000
2
Beds
2
Baths
2,650
Sq Ft
$240/Sq Ft
Est. Value
About This Home
This home is located at 3100 NE Wheeler St, Poulsbo, WA 98370 and is currently estimated at $635,203, approximately $239 per square foot. 3100 NE Wheeler St is a home with nearby schools including David Wolfle Elementary School, Kingston Middle School, and Kingston High School.
Ownership History
Date
Name
Owned For
Owner Type
Purchase Details
Closed on
Aug 6, 2025
Sold by
Tardif Deborah F and Tardif John E
Bought by
Coopersmith Matthew A and Tardif-Coopersmith Annette
Current Estimated Value
Home Financials for this Owner
Home Financials are based on the most recent Mortgage that was taken out on this home.
Original Mortgage
$300,000
Outstanding Balance
$299,742
Interest Rate
6.75%
Mortgage Type
New Conventional
Estimated Equity
$335,461
Purchase Details
Closed on
Nov 16, 2023
Sold by
Frol Steven C
Bought by
Tardif Deborah F
Purchase Details
Closed on
Jul 10, 2023
Sold by
Frol Steven C
Bought by
Hood Canal Llc
Purchase Details
Closed on
Jan 22, 1996
Sold by
Frol Cyril M and Frol Phyllis A
Bought by
Frol Steven C
Create a Home Valuation Report for This Property
The Home Valuation Report is an in-depth analysis detailing your home's value as well as a comparison with similar homes in the area
Home Values in the Area
Average Home Value in this Area
Purchase History
| Date | Buyer | Sale Price | Title Company |
|---|---|---|---|
| Coopersmith Matthew A | $1,350,000 | Horizon Title Group | |
| Tardif Deborah F | $250,000 | Land Title | |
| Hood Canal Llc | $313 | None Listed On Document | |
| Frol Steven C | -- | Charter Title Corp |
Source: Public Records
Mortgage History
| Date | Status | Borrower | Loan Amount |
|---|---|---|---|
| Open | Coopersmith Matthew A | $300,000 |
Source: Public Records
Tax History Compared to Growth
Tax History
| Year | Tax Paid | Tax Assessment Tax Assessment Total Assessment is a certain percentage of the fair market value that is determined by local assessors to be the total taxable value of land and additions on the property. | Land | Improvement |
|---|---|---|---|---|
| 2026 | $3,714 | $412,490 | $409,860 | $2,630 |
| 2025 | $3,714 | $412,490 | $409,860 | $2,630 |
| 2024 | $4,288 | $495,040 | $492,080 | $2,960 |
| 2023 | $2,899 | $324,320 | $321,360 | $2,960 |
| 2022 | $2,558 | $270,750 | $267,790 | $2,960 |
| 2021 | $2,389 | $233,670 | $230,710 | $2,960 |
| 2020 | $2,419 | $233,670 | $230,710 | $2,960 |
| 2019 | $2,176 | $208,960 | $206,000 | $2,960 |
| 2018 | $2,780 | $231,150 | $228,380 | $2,770 |
| 2017 | $2,662 | $231,150 | $228,380 | $2,770 |
| 2016 | $2,631 | $210,390 | $207,620 | $2,770 |
| 2015 | $2,612 | $210,390 | $207,620 | $2,770 |
| 2014 | -- | $210,390 | $207,620 | $2,770 |
| 2013 | -- | $210,390 | $207,620 | $2,770 |
Source: Public Records
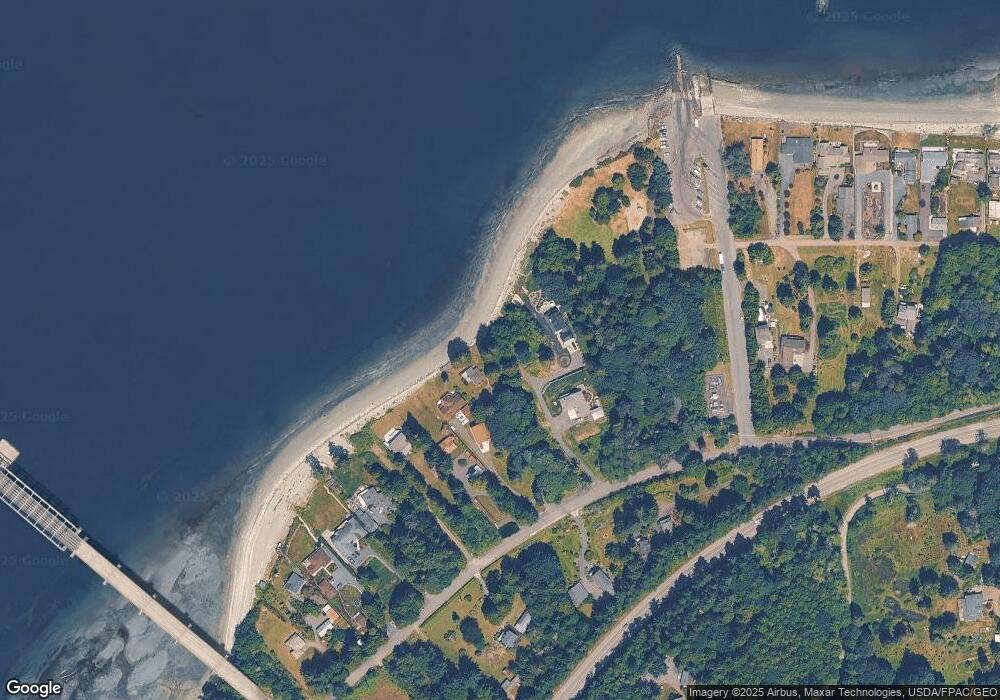
Map
Nearby Homes
- 2135 Shine Rd
- 29722 State Highway 3 NE
- 36 Seven Sisters Rd
- 0 Linda View Ln Unit NWM2374154
- 124 Hoods View Ct
- 131 Linda View Ln
- 29191 Scenic Dr NE
- 35275 Hood Canal Dr NE
- 111 Seven Sisters Beach
- 644 & 634 Bywater Way
- 34464 Bridge View Dr NE
- 40 Garten Rd
- 29711 Gamble Place NE
- 28xxx NE State Hwy 104
- 54 Ship View Ct
- 28393 State Hwy 3 NE
- 28389 State Highway 3 NE
- 13 White Rock Ln
- 15 White Rock Ln
- 0 XXX Gamble Bay Rd NE
- 3090 NE Wheeler St
- 3130 NE Wheeler St
- 3080 NE Wheeler St
- 3150 NE Wheeler St
- 3140 NE Wheeler St
- 3070 NE Wheeler St
- 3040 NE Wheeler St
- 3030 NE Wheeler St
- 3051 NE Wheeler St
- 3020 NE Wheeler St
- 32162 Whitford Rd NE
- 3649 NE Wheeler St
- 3035 NE Wheeler St
- 3344 NE Beach Ln
- 3398 NE Beach Ln
- 3010 NE Wheeler St
- 3000 NE Wheeler St
- 0 NE Wheeler St Unit 1320731
- 0 NE Wheeler St Unit 1320722
- 0 NE Wheeler St Unit 1474799