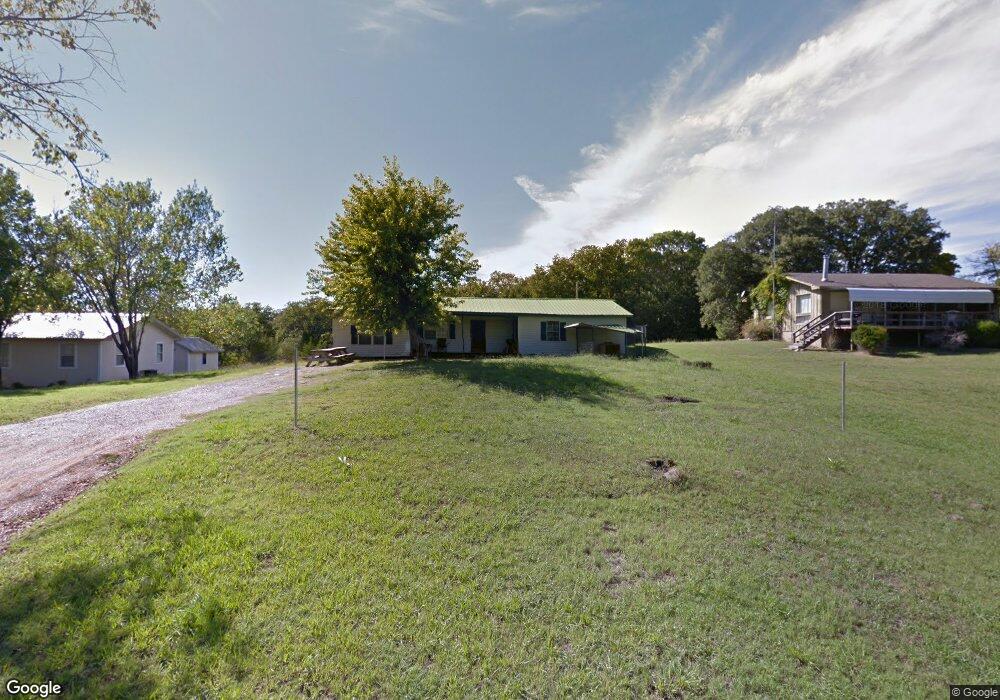
3100 Osage Rd Sulphur, OK 73086
Estimated Value: $64,000 - $208,000
3
Beds
2
Baths
1,068
Sq Ft
$144/Sq Ft
Est. Value
About This Home
This home is located at 3100 Osage Rd, Sulphur, OK 73086 and is currently estimated at $153,367, approximately $143 per square foot. 3100 Osage Rd is a home located in Murray County with nearby schools including Davis Elementary School, Davis Middle School, and Davis High School.
Ownership History
Date
Name
Owned For
Owner Type
Purchase Details
Closed on
Jan 30, 2024
Sold by
Brown Dalton J and Brown Lacey
Bought by
Glover Karen
Current Estimated Value
Purchase Details
Closed on
Feb 1, 2022
Sold by
Red Rock 2020 A Llc
Bought by
Brown Dalton J
Home Financials for this Owner
Home Financials are based on the most recent Mortgage that was taken out on this home.
Original Mortgage
$62,825
Interest Rate
3.45%
Mortgage Type
Construction
Purchase Details
Closed on
Nov 18, 2021
Sold by
Home Equity Mortgage Loan Asset-Backed T
Bought by
Red Rock 2020 A Llc
Purchase Details
Closed on
May 12, 2021
Sold by
Mackey Randy and Mackey Dee
Bought by
Deutsche Bank National Trust Company and Home Eqt Mtg Loan Asset Backed Tr Serie
Purchase Details
Closed on
Dec 4, 2003
Sold by
Pope Joanna
Bought by
Mackey Randy and Mackey Dee
Create a Home Valuation Report for This Property
The Home Valuation Report is an in-depth analysis detailing your home's value as well as a comparison with similar homes in the area
Home Values in the Area
Average Home Value in this Area
Purchase History
| Date | Buyer | Sale Price | Title Company |
|---|---|---|---|
| Glover Karen | $180,000 | First American Title | |
| Brown Dalton J | $45,000 | None Listed On Document | |
| Red Rock 2020 A Llc | $30,100 | Accommodation/Courtesy Recordi | |
| Deutsche Bank National Trust Company | $23,334 | None Available | |
| Mackey Randy | $2,300 | -- |
Source: Public Records
Mortgage History
| Date | Status | Borrower | Loan Amount |
|---|---|---|---|
| Previous Owner | Brown Dalton J | $62,825 |
Source: Public Records
Tax History Compared to Growth
Tax History
| Year | Tax Paid | Tax Assessment Tax Assessment Total Assessment is a certain percentage of the fair market value that is determined by local assessors to be the total taxable value of land and additions on the property. | Land | Improvement |
|---|---|---|---|---|
| 2024 | $465 | $4,950 | $451 | $4,499 |
| 2023 | $465 | $4,950 | $484 | $4,466 |
| 2022 | $246 | $2,519 | $253 | $2,266 |
| 2021 | $231 | $2,400 | $241 | $2,159 |
| 2020 | $212 | $2,285 | $228 | $2,057 |
| 2019 | $206 | $2,176 | $217 | $1,959 |
| 2018 | $194 | $2,072 | $259 | $1,813 |
| 2017 | $185 | $1,974 | $333 | $1,641 |
| 2016 | $178 | $1,880 | $265 | $1,615 |
| 2015 | $164 | $1,880 | $265 | $1,615 |
| 2014 | $165 | $1,880 | $265 | $1,615 |
Source: Public Records
Map
Nearby Homes
- 3012 Comanche Rd
- 2817 Creek Rd
- 2044 Blackfoot Rd
- 0 Arapaho Unit 2540961
- 0 Arapaho Unit 2540871
- 2540 Shalmar Rd
- 2488 La Vista St
- 2534 Seminole Dr
- 2664 Spence Rd
- 2688 Masters Rd
- 2676 Masters Rd
- 0 0092-00-005-043-0-038-00 Unit 1187208
- 2371 Seminole Dr
- 2369 Masters Rd
- 4015 Forrest Rd
- 2131 Sioux Dr
- 4080 Bud Dr
- 0 Hilltop Dr N
- 5256 Primrose Ln
- 0 Hickory Hill Dr Unit 2531638
- 3198 Osage Rd
- 3082 Osage Rd
- 3014 Osage Ln
- 3108 Osage Rd
- 3064 Osage Rd
- 3139 Osage Rd
- 4000 Chickasaw Trail
- 3133 Chickasaw Trail
- 3114 Pawnee
- 3057 Pawnee
- 2989 Blackfoot Rd
- 3025 Pawnee
- 3250 Osage Ln
- 4914 Shangrila Rd
- 4877 Shangri-La Rd
- 4785 Shangrila Rd
- 4850 Comanche Rd
- 4820 Shangrila Rd
- 4958 Shangrila Rd
- 3152 Navajo Rd