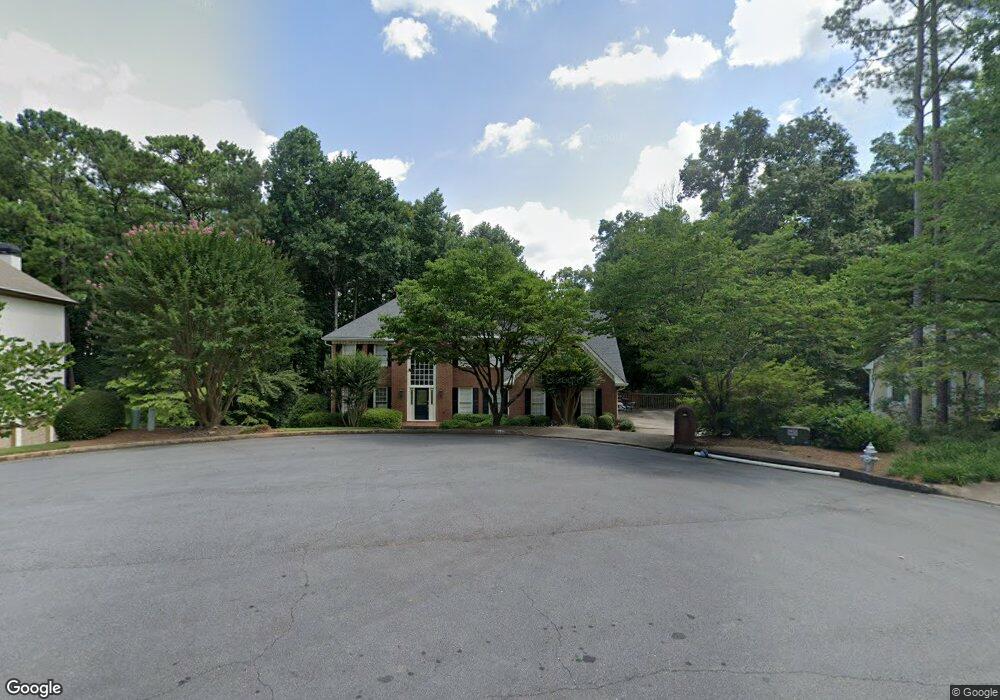
3100 Pillement Place Alpharetta, GA 30022
Newtown NeighborhoodEstimated Value: $643,000 - $706,000
5
Beds
4
Baths
2,398
Sq Ft
$280/Sq Ft
Est. Value
About This Home
This home is located at 3100 Pillement Place, Alpharetta, GA 30022 and is currently estimated at $671,668, approximately $280 per square foot. 3100 Pillement Place is a home located in Fulton County with nearby schools including Hillside Elementary School, Haynes Bridge Middle School, and Centennial High School.
Ownership History
Date
Name
Owned For
Owner Type
Purchase Details
Closed on
May 25, 2006
Sold by
Sisko Janice F
Bought by
Reams Michael L and Reams Ashley H
Current Estimated Value
Home Financials for this Owner
Home Financials are based on the most recent Mortgage that was taken out on this home.
Original Mortgage
$292,480
Outstanding Balance
$114,169
Interest Rate
1%
Mortgage Type
New Conventional
Estimated Equity
$557,499
Purchase Details
Closed on
Jun 3, 1998
Sold by
Freeman Terence
Bought by
Sisko Bernard G
Home Financials for this Owner
Home Financials are based on the most recent Mortgage that was taken out on this home.
Original Mortgage
$219,450
Interest Rate
7.1%
Mortgage Type
New Conventional
Purchase Details
Closed on
Feb 26, 1993
Sold by
Krauter Michael G Yvonne
Bought by
Freeman Terence
Home Financials for this Owner
Home Financials are based on the most recent Mortgage that was taken out on this home.
Original Mortgage
$185,250
Interest Rate
6.75%
Create a Home Valuation Report for This Property
The Home Valuation Report is an in-depth analysis detailing your home's value as well as a comparison with similar homes in the area
Home Values in the Area
Average Home Value in this Area
Purchase History
| Date | Buyer | Sale Price | Title Company |
|---|---|---|---|
| Reams Michael L | $365,600 | -- | |
| Sisko Bernard G | $231,000 | -- | |
| Freeman Terence | $195,000 | -- |
Source: Public Records
Mortgage History
| Date | Status | Borrower | Loan Amount |
|---|---|---|---|
| Open | Reams Michael L | $292,480 | |
| Previous Owner | Sisko Bernard G | $219,450 | |
| Previous Owner | Freeman Terence | $185,250 |
Source: Public Records
Tax History Compared to Growth
Tax History
| Year | Tax Paid | Tax Assessment Tax Assessment Total Assessment is a certain percentage of the fair market value that is determined by local assessors to be the total taxable value of land and additions on the property. | Land | Improvement |
|---|---|---|---|---|
| 2025 | $4,301 | $191,680 | $65,080 | $126,600 |
| 2023 | $4,301 | $198,040 | $52,080 | $145,960 |
| 2022 | $4,123 | $178,040 | $44,040 | $134,000 |
| 2021 | $4,097 | $166,760 | $32,680 | $134,080 |
| 2020 | $4,051 | $151,000 | $36,880 | $114,120 |
| 2019 | $466 | $153,680 | $35,680 | $118,000 |
| 2018 | $4,257 | $142,960 | $56,160 | $86,800 |
| 2017 | $3,809 | $124,080 | $49,320 | $74,760 |
| 2016 | $3,746 | $124,080 | $49,320 | $74,760 |
| 2015 | $3,787 | $124,080 | $49,320 | $74,760 |
| 2014 | $3,593 | $114,920 | $27,760 | $87,160 |
Source: Public Records
Map
Nearby Homes
- 835 Kings Arms Way
- 3235 Arborwoods Dr
- 125 Georgian Manor Ct
- 9245 Brumbelow Rd
- 150 Stoney Ridge Dr
- 215 Ridge Point Ct
- 9024 Tuckerbrook Ln
- 280 Vidaulan Ct
- 9165 Nesbit Ferry Rd Unit 9
- 235 Stoney Ridge Dr
- 9155 Nesbit Ferry Rd Unit 101
- 9155 Nesbit Ferry Rd Unit 96
- 51 Nesbit Place
- 140 Old Sandhurst Landing
- 160 Arden Place
- 2003 Falcon Glen Ct
- 3167 Arborwoods Dr
- 3080 Pillement Place
- 3175 Arborwoods Dr Unit 3
- 3080 Birchton St
- 3070 Birchton St Unit 1
- 3151 Arborwoods Dr
- 3085 Pillement Place
- 3070 Pillement Place
- 3143 Arborwoods Dr
- 0 Birchton St Unit 8742981
- 0 Birchton St Unit 8209393
- 0 Birchton St Unit 7270469
- 0 Birchton St Unit 3179855
- 0 Birchton St Unit 7355541
- 0 Birchton St Unit 7251884
- 3183 Arborwoods Dr
- 3100 Birchton St Unit 1
- 3189 Arborwoods Dr Unit 3
- 3050 Birchton St
- 3060 Pillement Place