Estimated Value: $191,007 - $230,000
--
Bed
2
Baths
1,344
Sq Ft
$158/Sq Ft
Est. Value
About This Home
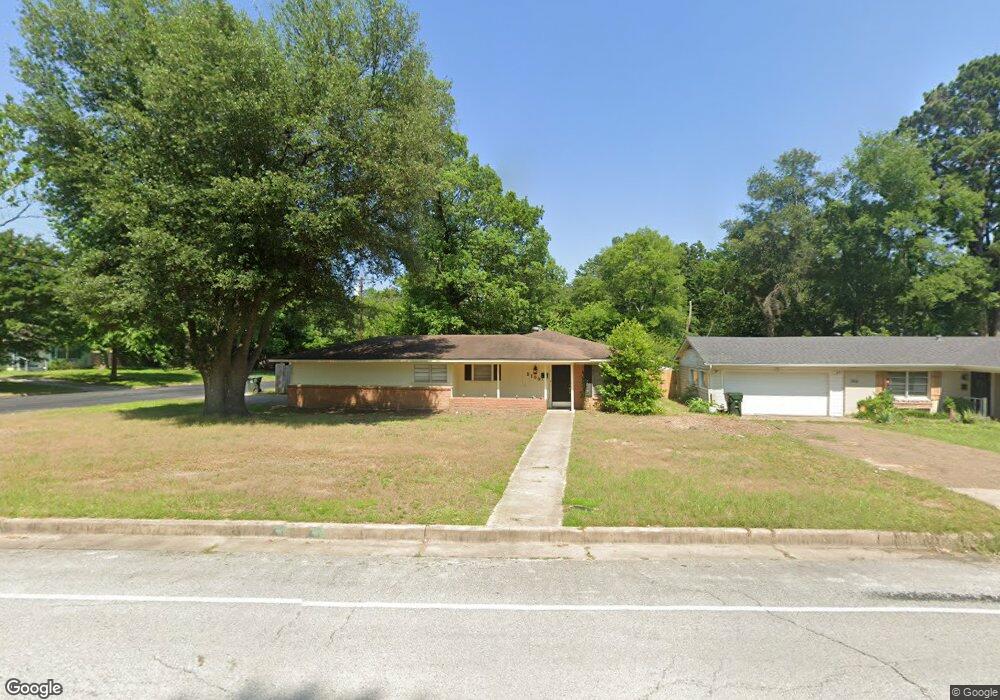
This home is located at 3100 S Donnybrook Ave, Tyler, TX 75701 and is currently estimated at $211,752, approximately $157 per square foot. 3100 S Donnybrook Ave is a home located in Smith County with nearby schools including Woods Elementary School, Hubbard Middle School, and Tyler Legacy High School.
Ownership History
Date
Name
Owned For
Owner Type
Purchase Details
Closed on
Apr 11, 2008
Sold by
The Gerald & Joan Smith Childrens Trust and Smith Brent L
Bought by
Bbkb Investments Llc
Current Estimated Value
Home Financials for this Owner
Home Financials are based on the most recent Mortgage that was taken out on this home.
Original Mortgage
$62,992
Interest Rate
6.19%
Mortgage Type
Purchase Money Mortgage
Create a Home Valuation Report for This Property
The Home Valuation Report is an in-depth analysis detailing your home's value as well as a comparison with similar homes in the area
Home Values in the Area
Average Home Value in this Area
Purchase History
| Date | Buyer | Sale Price | Title Company |
|---|---|---|---|
| Bbkb Investments Llc | -- | None Available |
Source: Public Records
Mortgage History
| Date | Status | Borrower | Loan Amount |
|---|---|---|---|
| Previous Owner | Bbkb Investments Llc | $62,992 |
Source: Public Records
Tax History Compared to Growth
Tax History
| Year | Tax Paid | Tax Assessment Tax Assessment Total Assessment is a certain percentage of the fair market value that is determined by local assessors to be the total taxable value of land and additions on the property. | Land | Improvement |
|---|---|---|---|---|
| 2025 | $3,198 | $185,449 | $22,504 | $162,945 |
| 2024 | $3,198 | $188,004 | $22,996 | $165,008 |
| 2023 | $2,854 | $163,738 | $22,996 | $140,742 |
| 2022 | $2,320 | $118,428 | $16,781 | $101,647 |
| 2021 | $1,726 | $82,249 | $16,781 | $65,468 |
| 2020 | $1,827 | $85,363 | $16,781 | $68,582 |
| 2019 | $1,712 | $78,299 | $12,430 | $65,869 |
| 2018 | $1,683 | $77,390 | $12,430 | $64,960 |
| 2017 | $1,559 | $73,001 | $12,430 | $60,571 |
| 2016 | $1,440 | $67,432 | $12,430 | $55,002 |
| 2015 | $1,435 | $69,088 | $12,430 | $56,658 |
| 2014 | $1,435 | $67,548 | $12,430 | $55,118 |
Source: Public Records
Map
Nearby Homes
- 315 Ridgecrest Dr
- 3202 S Donnybrook Ave
- 3210 S Donnybrook Ave
- 611 E Watkins St
- 121 Fair Ln
- 317 Amberwood Cir
- 2835 S Broadway Ave
- 905 E Watkins St
- 2736 Old Bullard Rd
- 3300 Old Bullard Rd
- 403 Beechwood Dr
- 309 Glenhaven Dr
- 904 E Dulse St
- 3308 Greenoak Place
- 1018 Pollard Dr
- 3511 S Keaton Ave
- 1101 Clyde Dr
- 2917 Sunnybrook Dr
- 3712 Colony Park Dr
- 505 Buckingham Place
- 3100 3100 Donnybrook
- 3106 S Donnybrook Ave
- 3106 3106 S Donnybrook Ave
- 419 Stanford St
- 3112 S Donnybrook Ave
- 3101 S Donnybrook Ave
- 410 Stanford St
- 420 Stanford St
- 3107 S Donnybrook Ave
- 404 Stanford St
- 3120 S Donnybrook Ave
- 3115 S Donnybrook Ave
- 427 Stanford St
- 316 Stanford St
- 316 316 Stanford
- 3011 Crestview St
- 3121 3121 Donnybrook
- 3121 S Donnybrook Ave
- 420 Tech Place
- 3124 S Donnybrook Ave