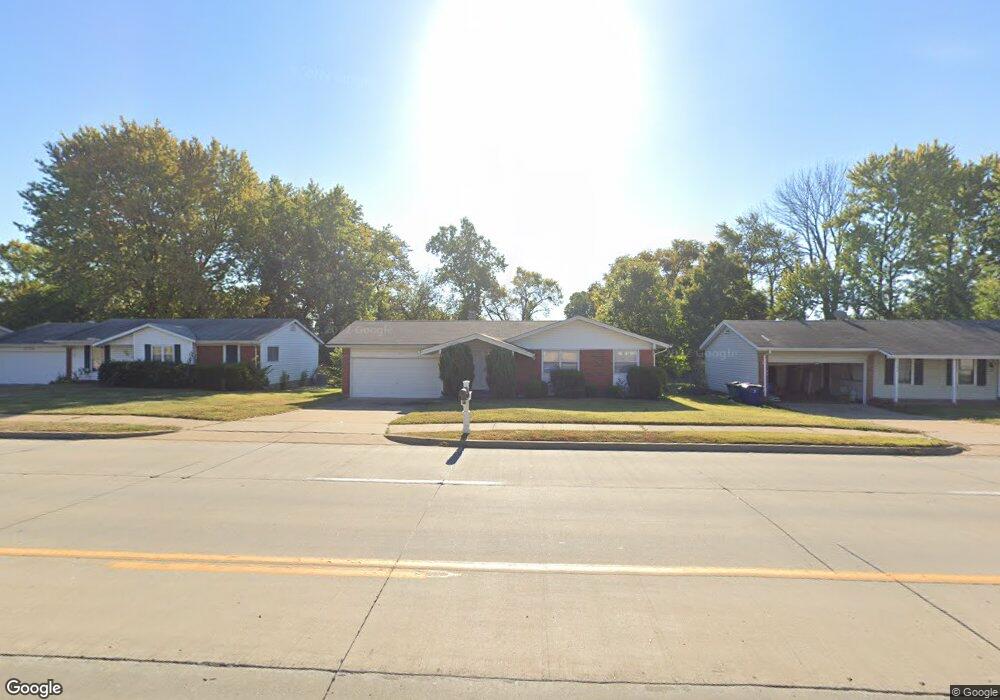
3100 Shackelford Rd Florissant, MO 63031
Estimated Value: $208,000 - $249,000
4
Beds
2
Baths
1,591
Sq Ft
$139/Sq Ft
Est. Value
About This Home
This home is located at 3100 Shackelford Rd, Florissant, MO 63031 and is currently estimated at $221,879, approximately $139 per square foot. 3100 Shackelford Rd is a home located in St. Louis County with nearby schools including North Middle School, Hazelwood Central High School, and Oak Bridge.
Ownership History
Date
Name
Owned For
Owner Type
Purchase Details
Closed on
Oct 2, 2023
Sold by
Porter Terence E
Bought by
Travis Antoinette R
Current Estimated Value
Purchase Details
Closed on
May 5, 2023
Sold by
Travis Antoinette R
Bought by
Travis Antoinette R and Talton Isaiah
Purchase Details
Closed on
Nov 17, 2010
Sold by
The J R Property Group Llc
Bought by
Travis Antoinette R and Porter Terrence E
Home Financials for this Owner
Home Financials are based on the most recent Mortgage that was taken out on this home.
Original Mortgage
$114,034
Interest Rate
4.25%
Mortgage Type
FHA
Purchase Details
Closed on
Mar 31, 2010
Sold by
Wells Fargo Bank Na
Bought by
Jr Property Group Llc
Purchase Details
Closed on
Jul 24, 2009
Sold by
Tepatti Stephen
Bought by
Wells Fargo Bank Na
Purchase Details
Closed on
Sep 12, 2006
Sold by
Hoover Randall and Hoover Terri Ann
Bought by
Tepatti Stephen
Home Financials for this Owner
Home Financials are based on the most recent Mortgage that was taken out on this home.
Original Mortgage
$116,000
Interest Rate
6.55%
Mortgage Type
Purchase Money Mortgage
Create a Home Valuation Report for This Property
The Home Valuation Report is an in-depth analysis detailing your home's value as well as a comparison with similar homes in the area
Home Values in the Area
Average Home Value in this Area
Purchase History
| Date | Buyer | Sale Price | Title Company |
|---|---|---|---|
| Travis Antoinette R | -- | None Listed On Document | |
| Travis Antoinette R | -- | None Listed On Document | |
| Travis Antoinette R | $117,000 | Multiple | |
| Jr Property Group Llc | $59,000 | Atc | |
| Wells Fargo Bank Na | $75,833 | None Available | |
| Tepatti Stephen | -- | None Available |
Source: Public Records
Mortgage History
| Date | Status | Borrower | Loan Amount |
|---|---|---|---|
| Previous Owner | Travis Antoinette R | $114,034 | |
| Previous Owner | Tepatti Stephen | $116,000 |
Source: Public Records
Tax History Compared to Growth
Tax History
| Year | Tax Paid | Tax Assessment Tax Assessment Total Assessment is a certain percentage of the fair market value that is determined by local assessors to be the total taxable value of land and additions on the property. | Land | Improvement |
|---|---|---|---|---|
| 2025 | $2,886 | $35,490 | $6,440 | $29,050 |
| 2024 | $2,886 | $33,050 | $2,570 | $30,480 |
| 2023 | $2,886 | $33,050 | $2,570 | $30,480 |
| 2022 | $2,501 | $25,520 | $4,200 | $21,320 |
| 2021 | $2,465 | $25,520 | $4,200 | $21,320 |
| 2020 | $2,592 | $25,000 | $6,440 | $18,560 |
| 2019 | $2,552 | $25,000 | $6,440 | $18,560 |
| 2018 | $2,273 | $20,450 | $2,000 | $18,450 |
| 2017 | $2,270 | $20,450 | $2,000 | $18,450 |
| 2016 | $2,290 | $20,350 | $2,340 | $18,010 |
| 2015 | $2,241 | $20,350 | $2,340 | $18,010 |
| 2014 | $2,055 | $19,210 | $3,900 | $15,310 |
Source: Public Records
Map
Nearby Homes
- 3035 Matlock Dr
- 1641 Sherwood Forest Dr
- 1522 Sherwood Forest Dr
- 2916 Corn Silk Ct
- 1807 Kilmory Dr
- 1638 Matlock Dr
- 2906 Russet Ct
- 1455 Burnside Ct
- 3213 Yvette Ct
- 1114 Ransome Ct
- 3645 Woodman Dr
- 3660 Woodman Dr
- 1323 Woodpath Dr
- 2235 Central Parkway Dr
- 2540 Courtyard Place
- 16787 River Stone Dr
- 733 Mediterranean Dr
- 16804 River Stone Dr
- 2932 Sherwood Dr
- 2618 Freemantle Dr
- 3110 Shackelford Rd
- 3080 Shackelford Rd
- 3105 Matlock Dr
- 3115 Matlock Dr
- 3120 Shackelford Rd
- 3095 Matlock Dr
- 3125 Matlock Dr
- 3014 Fireweed Ct
- 3130 Shackelford Rd
- 3085 Matlock Dr
- 3010 Fireweed Ct
- 3135 Matlock Dr
- 3006 Fireweed Ct
- 3018 Fireweed Ct
- 3075 Matlock Dr
- 1692 Sherwood Forest Dr
- 1691 Sherwood Forest Dr
- 3140 Shackelford Rd
- 3002 Fireweed Ct
- 3080 Matlock Dr