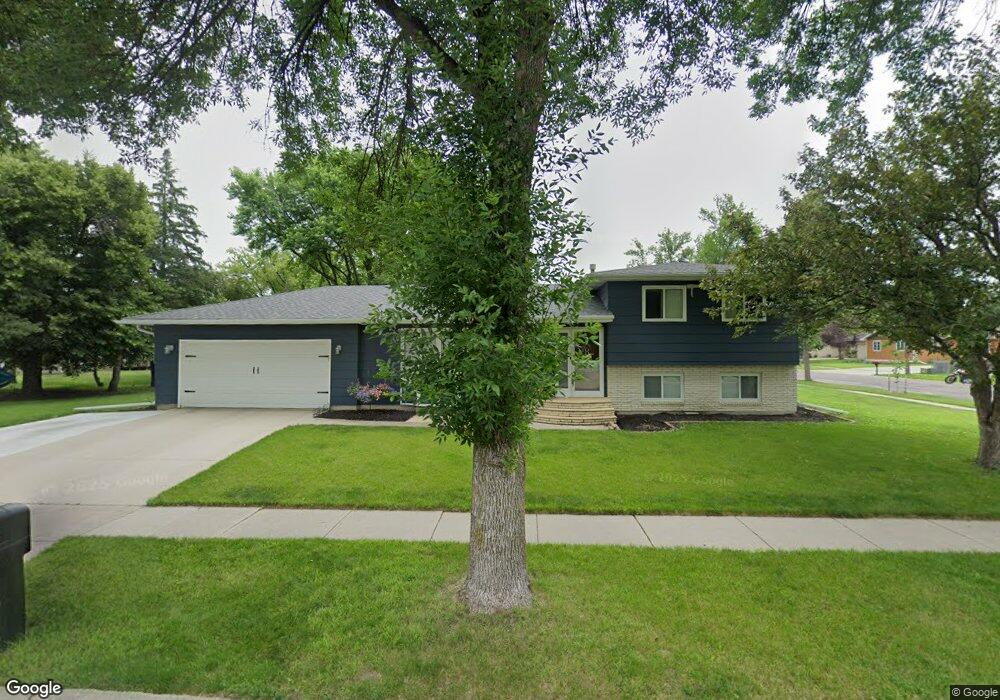
3101 2nd St N Fargo, ND 58102
Northport NeighborhoodEstimated Value: $314,000 - $366,000
Studio
--
Bath
1,506
Sq Ft
$224/Sq Ft
Est. Value
About This Home
This home is located at 3101 2nd St N, Fargo, ND 58102 and is currently estimated at $337,433, approximately $224 per square foot. 3101 2nd St N is a home located in Cass County with nearby schools including Longfellow Elementary School, Ben Franklin Middle School, and North High School.
Ownership History
Date
Name
Owned For
Owner Type
Purchase Details
Closed on
Aug 22, 2013
Sold by
Keil Richard L and Keil Sherril K
Bought by
Blaine Peter R and Blaine Gena T
Current Estimated Value
Home Financials for this Owner
Home Financials are based on the most recent Mortgage that was taken out on this home.
Original Mortgage
$178,900
Outstanding Balance
$133,781
Interest Rate
4.53%
Mortgage Type
New Conventional
Estimated Equity
$203,652
Create a Home Valuation Report for This Property
The Home Valuation Report is an in-depth analysis detailing your home's value as well as a comparison with similar homes in the area
Home Values in the Area
Average Home Value in this Area
Purchase History
| Date | Buyer | Sale Price | Title Company |
|---|---|---|---|
| Blaine Peter R | $198,900 | Northern Title Co |
Source: Public Records
Mortgage History
| Date | Status | Borrower | Loan Amount |
|---|---|---|---|
| Open | Blaine Peter R | $178,900 |
Source: Public Records
Tax History
| Year | Tax Paid | Tax Assessment Tax Assessment Total Assessment is a certain percentage of the fair market value that is determined by local assessors to be the total taxable value of land and additions on the property. | Land | Improvement |
|---|---|---|---|---|
| 2024 | $4,110 | $155,400 | $38,900 | $116,500 |
| 2023 | $4,353 | $146,600 | $38,900 | $107,700 |
| 2022 | $3,739 | $130,900 | $38,900 | $92,000 |
| 2021 | $3,351 | $119,000 | $38,900 | $80,100 |
| 2020 | $3,104 | $111,200 | $38,900 | $72,300 |
| 2019 | $3,107 | $111,200 | $21,600 | $89,600 |
| 2018 | $2,625 | $98,650 | $21,600 | $77,050 |
| 2017 | $2,586 | $95,800 | $21,600 | $74,200 |
| 2016 | $2,239 | $89,550 | $21,600 | $67,950 |
| 2015 | $2,383 | $89,550 | $16,200 | $73,350 |
| 2014 | $2,640 | $97,400 | $16,200 | $81,200 |
| 2013 | $2,526 | $92,750 | $16,200 | $76,550 |
Source: Public Records
Map
Nearby Homes
- 3223 2nd St N
- 3307-3309 2nd St N
- 2925 Edgewood Dr N
- 21 35th Ave NE
- 2939 Maple St N
- 3402 Par St N
- 3525 Longfellow Rd N
- 3110 Broadway N
- 2807 Edgewood Dr N
- 3521 Grandwood Dr N
- 3667 Evergreen Rd N
- 105 24th Ave N
- 306 25th Ave N
- 2501 9th St N
- 2814 10th St N
- 301 21st Ave N
- 3737 10th St N
- 2001 8th St N
- 3829 10th St N
- 1830 4th St N
Your Personal Tour Guide
Ask me questions while you tour the home.