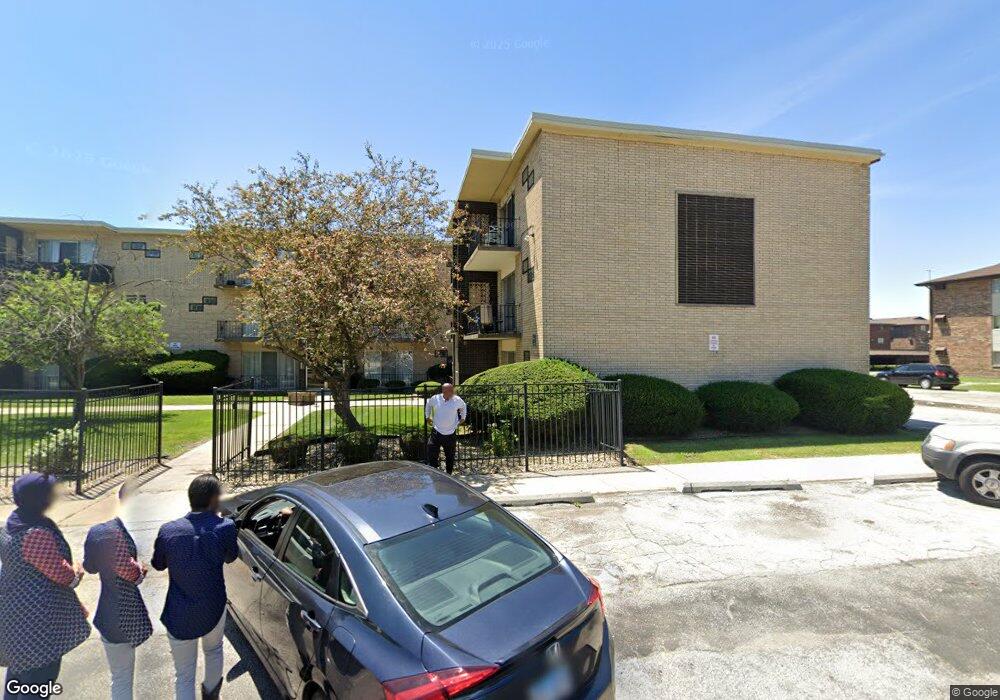
Bernice Terraces 3101 Bernice Rd Unit 31331 Lansing, IL 60438
Estimated Value: $80,000 - $117,086
2
Beds
1
Bath
750
Sq Ft
$123/Sq Ft
Est. Value
About This Home
This home is located at 3101 Bernice Rd Unit 31331, Lansing, IL 60438 and is currently estimated at $92,522, approximately $123 per square foot. 3101 Bernice Rd Unit 31331 is a home located in Cook County with nearby schools including Reavis Elementary School, Memorial Jr High School, and Thornton Fractnl So High School.
Ownership History
Date
Name
Owned For
Owner Type
Purchase Details
Closed on
Sep 13, 2023
Sold by
Nayr Construction And Management Inc
Bought by
Farrell Lisa
Current Estimated Value
Purchase Details
Closed on
Dec 11, 2015
Sold by
Jkassociates4 Llc
Bought by
Nayr Construction & Management Inc
Purchase Details
Closed on
Sep 18, 2009
Sold by
Khurana Jagdish
Bought by
Jk Associates & Llc
Purchase Details
Closed on
Jul 8, 2009
Sold by
Fannie Mae
Bought by
Khurana Jagdish
Purchase Details
Closed on
Nov 19, 2007
Sold by
Wells Fargo Bank Na
Bought by
Federal National Mortgage Association
Purchase Details
Closed on
Sep 4, 2007
Sold by
Reed Constance C
Bought by
Wells Fargo Bank Na
Purchase Details
Closed on
Nov 25, 1997
Sold by
Ncc Bernice Terrace Llc
Bought by
Reed Constance C
Home Financials for this Owner
Home Financials are based on the most recent Mortgage that was taken out on this home.
Original Mortgage
$56,150
Interest Rate
7.45%
Create a Home Valuation Report for This Property
The Home Valuation Report is an in-depth analysis detailing your home's value as well as a comparison with similar homes in the area
Home Values in the Area
Average Home Value in this Area
Purchase History
| Date | Buyer | Sale Price | Title Company |
|---|---|---|---|
| Farrell Lisa | $80,000 | None Listed On Document | |
| Nayr Construction & Management Inc | $12,000 | Attorney | |
| Jk Associates & Llc | -- | None Available | |
| Khurana Jagdish | -- | Git | |
| Federal National Mortgage Association | -- | None Available | |
| Wells Fargo Bank Na | -- | None Available | |
| Reed Constance C | $58,000 | -- |
Source: Public Records
Mortgage History
| Date | Status | Borrower | Loan Amount |
|---|---|---|---|
| Previous Owner | Reed Constance C | $56,150 |
Source: Public Records
Tax History Compared to Growth
Tax History
| Year | Tax Paid | Tax Assessment Tax Assessment Total Assessment is a certain percentage of the fair market value that is determined by local assessors to be the total taxable value of land and additions on the property. | Land | Improvement |
|---|---|---|---|---|
| 2024 | $2,903 | $6,001 | $427 | $5,574 |
| 2023 | $2,080 | $6,001 | $427 | $5,574 |
| 2022 | $2,080 | $3,202 | $587 | $2,615 |
| 2021 | $2,024 | $3,201 | $586 | $2,615 |
| 2020 | $1,878 | $3,201 | $586 | $2,615 |
| 2019 | $2,331 | $4,094 | $533 | $3,561 |
| 2018 | $2,288 | $4,094 | $533 | $3,561 |
| 2017 | $2,310 | $4,094 | $533 | $3,561 |
| 2016 | $3,145 | $5,751 | $480 | $5,271 |
| 2015 | $2,922 | $5,751 | $480 | $5,271 |
| 2014 | $2,881 | $5,751 | $480 | $5,271 |
| 2013 | $738 | $4,268 | $480 | $3,788 |
Source: Public Records
About Bernice Terraces
Map
Nearby Homes
- 3026 Bernice Rd Unit 308
- 17318 Walter St
- 3253 Bernice Rd
- 3425 Bernice Ave
- 17256 Walter St
- 17303 Chicago Ave
- 17518 Roy St
- 2950 Bernice Rd
- 17317 Roy St
- 17303 Roy St
- 17552 Roy St
- 17335 Community St
- 17218 Park Ave
- 17331 Community St
- 3347 Bernice Rd
- 17519 Community St
- 17226 Community St
- 17157 Walter St
- 17153 Walter St
- 17641 Burnham Ave
- 3101 Bernice Rd Unit 31512
- 3101 Bernice Rd Unit 31452
- 3101 Bernice Rd Unit 31396
- 3101 Bernice Rd Unit 31395
- 3101 Bernice Rd Unit 31192
- 3101 Bernice Rd Unit 31191
- 3101 Bernice Rd Unit 31011
- 3101 Bernice Rd Unit 31393
- 3101 Bernice Rd Unit 31014
- 3101 Bernice Rd Unit 31335
- 3101 Bernice Rd Unit 31394
- 3101 Bernice Rd Unit 31275
- 3101 Bernice Rd Unit 31392
- 3101 Bernice Rd Unit 31255
- 3101 Bernice Rd Unit 31513
- 3101 Bernice Rd Unit 31013
- 3101 Bernice Rd Unit 31514
- 3101 Bernice Rd Unit 31016
- 3101 Bernice Rd Unit 31253
- 3101 Bernice Rd Unit 31391