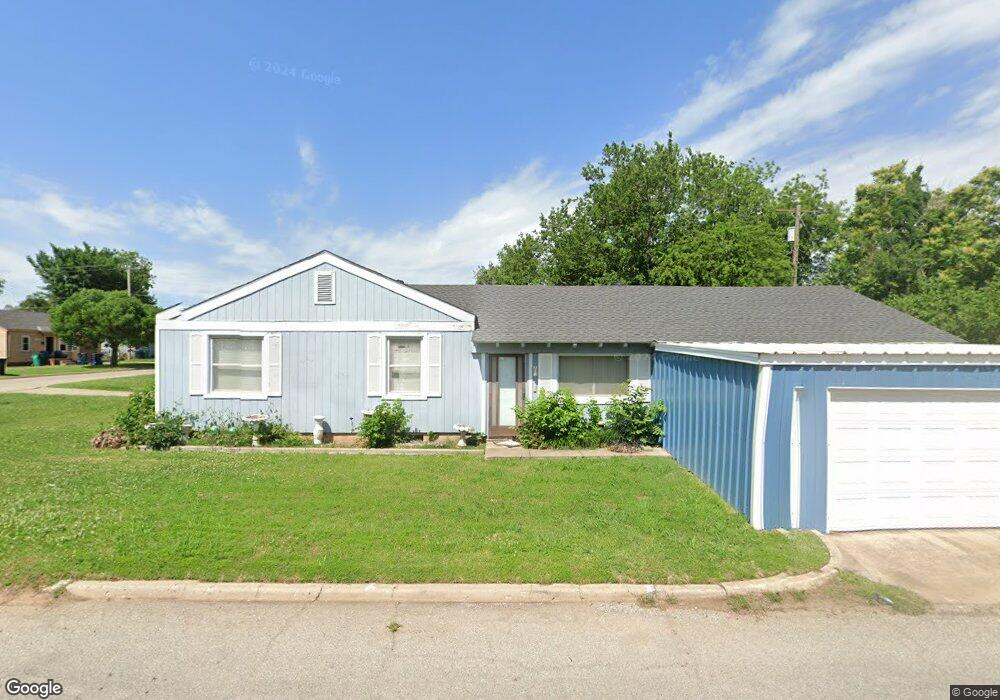
3101 Cashion Place Oklahoma City, OK 73112
Lyons Park NeighborhoodEstimated Value: $100,000 - $160,000
3
Beds
2
Baths
1,132
Sq Ft
$125/Sq Ft
Est. Value
About This Home
This home is located at 3101 Cashion Place, Oklahoma City, OK 73112 and is currently estimated at $141,995, approximately $125 per square foot. 3101 Cashion Place is a home located in Oklahoma County with nearby schools including Kaiser Elementary School, Taft Middle School, and Northwest Classen High School.
Ownership History
Date
Name
Owned For
Owner Type
Purchase Details
Closed on
Sep 10, 2018
Sold by
Green Tracy
Bought by
Basinger William Dean
Current Estimated Value
Purchase Details
Closed on
Aug 21, 2018
Sold by
Green Trevor
Bought by
Basinger William Dean
Purchase Details
Closed on
Sep 28, 1999
Sold by
King Karen L and The Karen King Revocable Livin
Bought by
Green Kathy L
Home Financials for this Owner
Home Financials are based on the most recent Mortgage that was taken out on this home.
Original Mortgage
$35,100
Interest Rate
11.9%
Purchase Details
Closed on
May 31, 1999
Sold by
Meadows Nancy Joline and Meadows Chamus P
Bought by
King Karen L and Karen King Revocable Living Tr
Purchase Details
Closed on
Jun 30, 1997
Sold by
King Karen L
Bought by
Meadows Chamus P and Meadows Nancy Joline
Home Financials for this Owner
Home Financials are based on the most recent Mortgage that was taken out on this home.
Original Mortgage
$42,000
Interest Rate
7.94%
Mortgage Type
Seller Take Back
Create a Home Valuation Report for This Property
The Home Valuation Report is an in-depth analysis detailing your home's value as well as a comparison with similar homes in the area
Home Values in the Area
Average Home Value in this Area
Purchase History
| Date | Buyer | Sale Price | Title Company |
|---|---|---|---|
| Basinger William Dean | -- | None Available | |
| Basinger William Dean | -- | None Available | |
| Green Kathy L | $39,000 | -- | |
| King Karen L | $42,000 | -- | |
| Meadows Chamus P | $42,000 | -- |
Source: Public Records
Mortgage History
| Date | Status | Borrower | Loan Amount |
|---|---|---|---|
| Previous Owner | Green Kathy L | $35,100 | |
| Previous Owner | Meadows Chamus P | $42,000 |
Source: Public Records
Tax History Compared to Growth
Tax History
| Year | Tax Paid | Tax Assessment Tax Assessment Total Assessment is a certain percentage of the fair market value that is determined by local assessors to be the total taxable value of land and additions on the property. | Land | Improvement |
|---|---|---|---|---|
| 2024 | $1,102 | $9,422 | $1,166 | $8,256 |
| 2023 | $1,102 | $8,974 | $1,259 | $7,715 |
| 2022 | $1,005 | $8,547 | $1,481 | $7,066 |
| 2021 | $958 | $8,140 | $1,619 | $6,521 |
| 2020 | $923 | $7,755 | $1,208 | $6,547 |
| 2019 | $890 | $7,480 | $1,208 | $6,272 |
| 2018 | $830 | $7,315 | $0 | $0 |
| 2017 | $817 | $7,204 | $1,208 | $5,996 |
| 2016 | $792 | $6,984 | $1,397 | $5,587 |
| 2015 | $783 | $6,837 | $1,397 | $5,440 |
| 2014 | $768 | $6,747 | $1,397 | $5,350 |
Source: Public Records
Map
Nearby Homes
- 3101 NW 29th St
- 3128 NW 30th St
- 3012 NW 32nd St
- 2928 NW 30th St
- 3120 NW 33rd St
- 3209 NW 31st St
- 3145 NW 32nd St
- 3016 NW 28th St
- 3217 NW 29th St
- 3228 Cashion Place
- 3004 Pioneer Ave
- 3217 NW 34th St
- 3116 N Ross Ave
- 3201 Winter Dr
- 2737 Cashion Place
- 3623 Linda Ave
- 3157 NW 25th St
- 2705 NW 31st St
- 3013 NW 24th St
- 3628 N Independence Ave
- 3105 Cashion Place
- 3109 Cashion Place
- 3100 NW 31st St
- 3104 NW 31st St
- 3113 Cashion Place
- 3108 NW 31st St
- 3100 Cashion Place
- 3104 Cashion Place
- 3044 Cashion Place
- 3108 Cashion Place
- 3112 NW 31st St
- 3117 Cashion Place
- 3040 Cashion Place
- 3037 Cashion Place
- 3044 NW 31st St
- 3112 Cashion Place
- 3116 NW 31st St
- 3040 NW 31st St
- 3036 Cashion Place
- 3121 Cashion Place