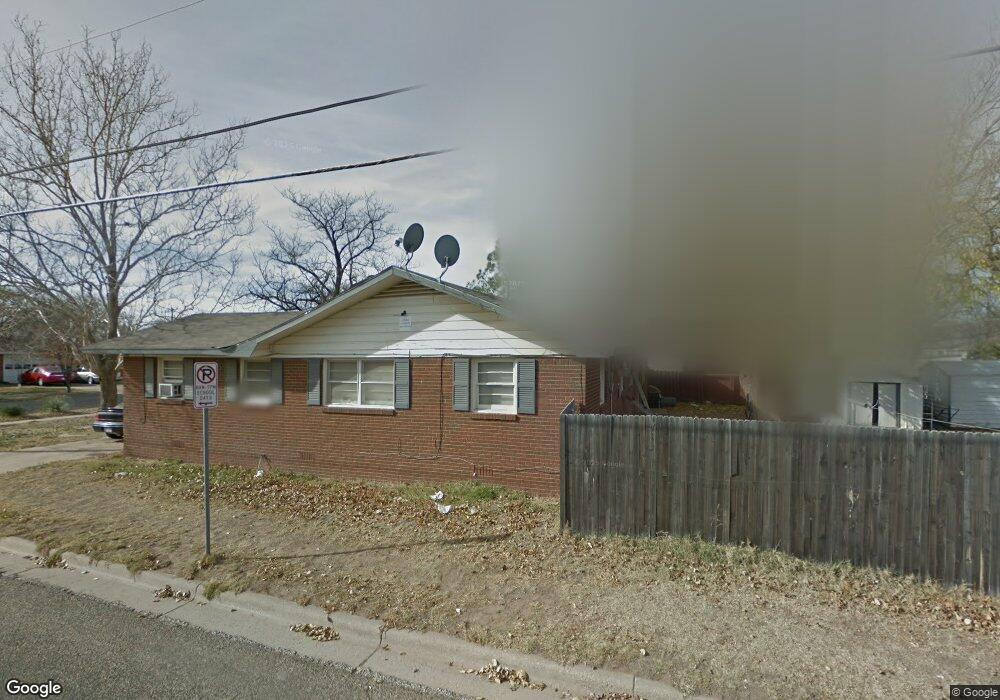
3102 48th St Lubbock, TX 79413
Wheelock & Monterey (WHAM) NeighborhoodEstimated Value: $142,000 - $162,000
3
Beds
2
Baths
1,433
Sq Ft
$108/Sq Ft
Est. Value
About This Home
This home is located at 3102 48th St, Lubbock, TX 79413 and is currently estimated at $154,162, approximately $107 per square foot. 3102 48th St is a home located in Lubbock County with nearby schools including Wheelock Elementary School, Slaton Middle School, and Monterey High School.
Ownership History
Date
Name
Owned For
Owner Type
Purchase Details
Closed on
Jun 13, 2019
Sold by
Clarke Terry Don
Bought by
Clark Michael Alexander
Current Estimated Value
Purchase Details
Closed on
Apr 11, 2018
Sold by
Clarke Terry Don
Bought by
Clarke Terry Don and Terry Clarke Revocable Living
Purchase Details
Closed on
Jun 4, 2008
Sold by
Tapp Gary D and Tapp Steva M
Bought by
Clarke Terry
Purchase Details
Closed on
Dec 1, 1985
Sold by
Parker Harold L
Bought by
Clarke Terry
Purchase Details
Closed on
Jun 1, 1984
Sold by
Digregorio Michael L
Bought by
Clarke Terry
Create a Home Valuation Report for This Property
The Home Valuation Report is an in-depth analysis detailing your home's value as well as a comparison with similar homes in the area
Home Values in the Area
Average Home Value in this Area
Purchase History
| Date | Buyer | Sale Price | Title Company |
|---|---|---|---|
| Clark Michael Alexander | -- | None Available | |
| Clarke Terry Don | -- | None Available | |
| Clarke Terry | -- | -- | |
| Clarke Terry | -- | -- | |
| Clarke Terry | -- | -- |
Source: Public Records
Tax History
| Year | Tax Paid | Tax Assessment Tax Assessment Total Assessment is a certain percentage of the fair market value that is determined by local assessors to be the total taxable value of land and additions on the property. | Land | Improvement |
|---|---|---|---|---|
| 2025 | $1,843 | $152,737 | $27,000 | $125,737 |
| 2024 | $28 | $154,338 | $27,000 | $127,338 |
| 2023 | $2,560 | $137,732 | $13,200 | $124,532 |
| 2022 | $2,535 | $125,211 | $13,200 | $128,940 |
| 2021 | $2,438 | $113,828 | $13,200 | $105,569 |
| 2020 | $2,250 | $103,480 | $13,200 | $90,280 |
| 2019 | $2,368 | $105,501 | $13,200 | $92,301 |
| 2018 | $2,331 | $103,688 | $13,200 | $90,488 |
| 2017 | $2,123 | $94,331 | $13,200 | $81,131 |
| 2016 | $1,930 | $85,755 | $4,500 | $81,255 |
| 2015 | $1,183 | $77,959 | $4,500 | $73,459 |
| 2014 | $1,183 | $77,959 | $4,500 | $73,459 |
Source: Public Records
Map
Nearby Homes
Your Personal Tour Guide
Ask me questions while you tour the home.