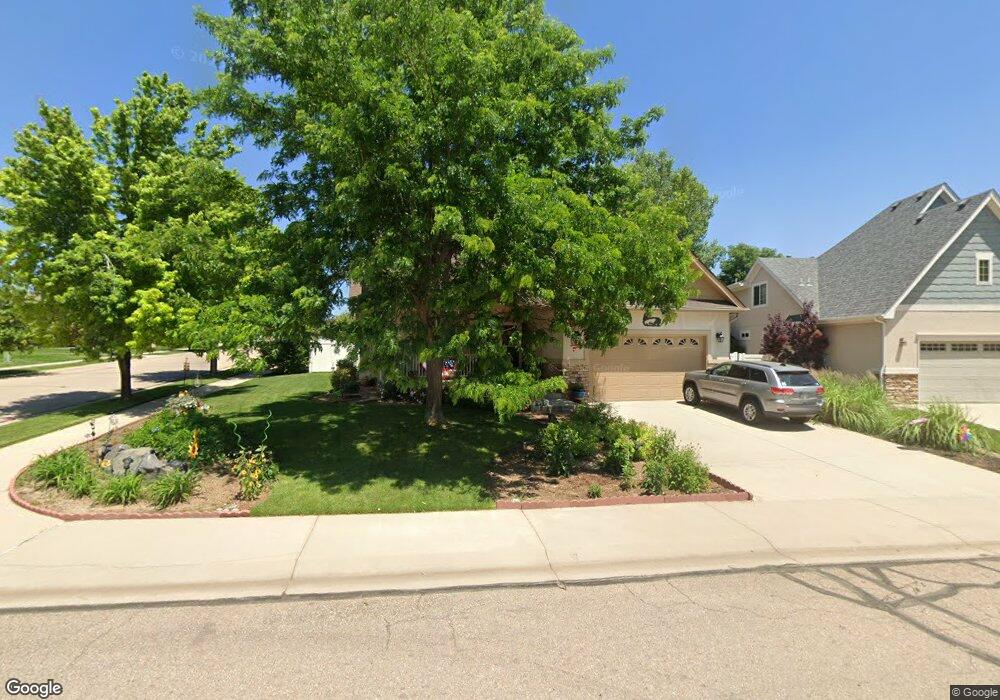
3102 68th Ave Ct Greeley, CO 80634
Estimated Value: $491,794 - $571,000
4
Beds
3
Baths
1,875
Sq Ft
$283/Sq Ft
Est. Value
About This Home
This home is located at 3102 68th Ave Ct, Greeley, CO 80634 and is currently estimated at $529,949, approximately $282 per square foot. 3102 68th Ave Ct is a home located in Weld County with nearby schools including Greeley Central High School, Union Colony Preparatory School, and Mountain View Academy.
Ownership History
Date
Name
Owned For
Owner Type
Purchase Details
Closed on
Mar 23, 2021
Sold by
Kochan Kenneth F
Bought by
Kochan Kenneth F and Kochan Elizabeth
Current Estimated Value
Home Financials for this Owner
Home Financials are based on the most recent Mortgage that was taken out on this home.
Original Mortgage
$356,040
Outstanding Balance
$319,703
Interest Rate
2.8%
Mortgage Type
FHA
Estimated Equity
$210,246
Purchase Details
Closed on
Jun 12, 2018
Sold by
Manalabe Voctoria W
Bought by
Manalabe Victoria W and Walton Mary Lee
Home Financials for this Owner
Home Financials are based on the most recent Mortgage that was taken out on this home.
Original Mortgage
$358,388
Interest Rate
4.5%
Mortgage Type
FHA
Purchase Details
Closed on
Oct 29, 2003
Sold by
Tom Keberlein Construction Llc
Bought by
Walton Jeanette L
Purchase Details
Closed on
Jun 5, 2003
Sold by
Meyer Farm Development Inc
Bought by
Tom Keberlein Construction Llc
Create a Home Valuation Report for This Property
The Home Valuation Report is an in-depth analysis detailing your home's value as well as a comparison with similar homes in the area
Home Values in the Area
Average Home Value in this Area
Purchase History
| Date | Buyer | Sale Price | Title Company |
|---|---|---|---|
| Kochan Kenneth F | -- | None Available | |
| Manalabe Victoria W | -- | None Available | |
| Kochan Kenneth F | $365,000 | None Available | |
| Walton Jeanette L | $254,350 | -- | |
| Tom Keberlein Construction Llc | $53,000 | -- |
Source: Public Records
Mortgage History
| Date | Status | Borrower | Loan Amount |
|---|---|---|---|
| Open | Kochan Kenneth F | $356,040 | |
| Closed | Kochan Kenneth F | $358,388 |
Source: Public Records
Tax History
| Year | Tax Paid | Tax Assessment Tax Assessment Total Assessment is a certain percentage of the fair market value that is determined by local assessors to be the total taxable value of land and additions on the property. | Land | Improvement |
|---|---|---|---|---|
| 2025 | $2,462 | $31,040 | $7,190 | $23,850 |
| 2024 | $2,462 | $31,040 | $7,190 | $23,850 |
| 2023 | $2,348 | $32,900 | $6,770 | $26,130 |
| 2022 | $2,208 | $25,200 | $4,870 | $20,330 |
| 2021 | $2,278 | $25,930 | $5,010 | $20,920 |
| 2020 | $2,238 | $25,550 | $3,930 | $21,620 |
| 2019 | $2,244 | $25,550 | $3,930 | $21,620 |
| 2018 | $1,309 | $22,930 | $3,890 | $19,040 |
| 2017 | $1,316 | $22,930 | $3,890 | $19,040 |
| 2016 | $1,054 | $22,120 | $2,950 | $19,170 |
| 2015 | $1,050 | $22,120 | $2,950 | $19,170 |
| 2014 | $706 | $17,260 | $2,070 | $15,190 |
Source: Public Records
Map
Nearby Homes
- 3114 68th Ave Ct
- 6813 W 31st St
- 3016 68th Ave
- 3220 66th Avenue Ct
- 3310 66th Avenue Ct
- 3696 65th Ave
- 6349 Ashcroft Rd
- 6639 W 28th St
- 6460 Orchard Park Dr Unit 4
- 3323 Borrossa St
- 3316 Barbera St
- 6340 Orchard Park Dr Unit 1
- 6340 Orchard Park Dr Unit 2
- 3323 Costanita St
- 3303 Sapphire Ct
- 3307 Sapphire Ct
- 3311 Sapphire Ct
- 3300 Sapphire Ct
- 3304 Sapphire Ct
- 3315 Sapphire Ct
- 3102 68th Avenue Ct
- 3106 68th Avenue Ct
- 3106 68th Ave Ct
- 3106 68th Avenue Ct
- 3110 68th Ave Ct
- 3110 68th Avenue Ct
- 3032 68th Ave Ct
- 3032 68th Avenue Ct
- 3103 68th Avenue Ct
- 6728 31st Street Rd
- 3103 68th Ave Ct
- 6724 31st Street Rd
- 3109 68th Avenue Ct
- 3114 68th Avenue Ct
- 3028 68th Ave Ct
- 3028 68th Avenue Ct
- 3109 68th Ave Ct
- 3114 68th Avenue Ct
- 3028 68th Ave
- 3027 68th Ave
Your Personal Tour Guide
Ask me questions while you tour the home.