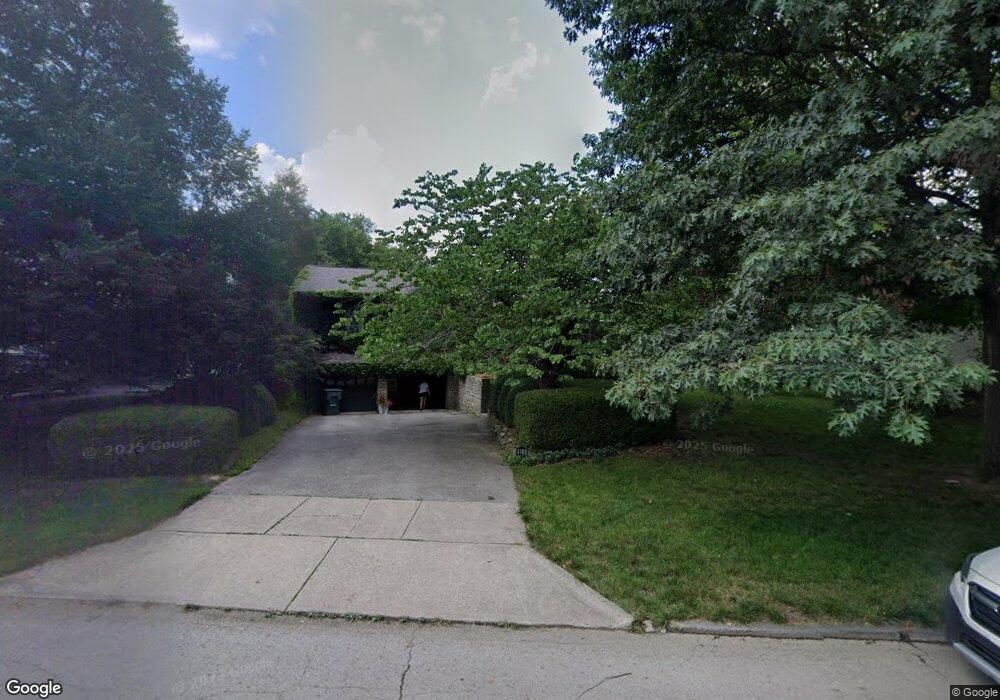
3102 Elbern Ave Columbus, OH 43209
Eastmoor NeighborhoodEstimated Value: $522,000 - $595,000
2
Beds
2
Baths
2,224
Sq Ft
$253/Sq Ft
Est. Value
About This Home
This home is located at 3102 Elbern Ave, Columbus, OH 43209 and is currently estimated at $562,085, approximately $252 per square foot. 3102 Elbern Ave is a home located in Franklin County with nearby schools including Fairmoor Elementary School, Johnson Park Middle School, and Walnut Ridge High School.
Ownership History
Date
Name
Owned For
Owner Type
Purchase Details
Closed on
Jan 27, 2017
Sold by
Cromwell Todd S and Boyd Paul D
Bought by
Horvath Eric R and Mensard Nikki S
Current Estimated Value
Home Financials for this Owner
Home Financials are based on the most recent Mortgage that was taken out on this home.
Original Mortgage
$436,050
Outstanding Balance
$358,993
Interest Rate
4%
Mortgage Type
Adjustable Rate Mortgage/ARM
Estimated Equity
$203,092
Purchase Details
Closed on
Jul 30, 2001
Sold by
Wolman Benson A and Wolman Herbert P
Bought by
Cromwell Todd S and Boyd Paul D
Home Financials for this Owner
Home Financials are based on the most recent Mortgage that was taken out on this home.
Original Mortgage
$138,500
Interest Rate
7.16%
Create a Home Valuation Report for This Property
The Home Valuation Report is an in-depth analysis detailing your home's value as well as a comparison with similar homes in the area
Home Values in the Area
Average Home Value in this Area
Purchase History
| Date | Buyer | Sale Price | Title Company |
|---|---|---|---|
| Horvath Eric R | $459,000 | Clean Title Agency Inc | |
| Cromwell Todd S | $163,000 | Hummel Title Agency Inc |
Source: Public Records
Mortgage History
| Date | Status | Borrower | Loan Amount |
|---|---|---|---|
| Open | Horvath Eric R | $436,050 | |
| Closed | Cromwell Todd S | $138,500 |
Source: Public Records
Tax History Compared to Growth
Tax History
| Year | Tax Paid | Tax Assessment Tax Assessment Total Assessment is a certain percentage of the fair market value that is determined by local assessors to be the total taxable value of land and additions on the property. | Land | Improvement |
|---|---|---|---|---|
| 2024 | $7,051 | $157,120 | $50,580 | $106,540 |
| 2023 | $6,961 | $157,115 | $50,575 | $106,540 |
| 2022 | $6,906 | $133,150 | $33,710 | $99,440 |
| 2021 | $6,918 | $133,150 | $33,710 | $99,440 |
| 2020 | $6,927 | $133,150 | $33,710 | $99,440 |
| 2019 | $6,446 | $106,260 | $26,950 | $79,310 |
| 2018 | $5,665 | $106,260 | $26,950 | $79,310 |
| 2017 | $5,840 | $96,320 | $26,950 | $69,370 |
| 2016 | $5,396 | $81,450 | $22,090 | $59,360 |
| 2015 | $4,898 | $81,450 | $22,090 | $59,360 |
| 2014 | $4,910 | $81,450 | $22,090 | $59,360 |
| 2013 | $2,422 | $81,445 | $22,085 | $59,360 |
Source: Public Records
Map
Nearby Homes
- 239 S Kellner Rd
- 50 S Chesterfield Rd
- 247 S James Rd
- 277 S James Rd
- 297 S James Rd
- 142 S Gould Rd
- 123 S Gould Rd
- 47 N Chesterfield Rd
- 50 N Broadleigh Rd
- 430 S James Rd
- 124 N Gould Rd
- 3160 Fair Ave
- 184 S Hampton Rd
- 208 S Stanwood Rd
- 2731 E Broad St
- 2738 E Broad St
- 2717 E Broad St
- 59 N Everett Ave
- 565 S Kellner Rd
- 73 N Everett Ave
- 3092 Elbern Ave
- 139 Eastmoor Blvd
- 3120 Elbern Ave
- 3082 Elbern Ave
- 125 Eastmoor Blvd
- 160 S Virginia Lee Rd
- 186 S Virginia Lee Rd
- 190 S Virginia Lee Rd
- 146 S Virginia Lee Rd
- 117 Eastmoor Blvd
- 3070 Elbern Ave
- 3097 Elbern Ave
- 126 S Virginialee Rd
- 3105 Elbern Ave
- 126 S Virginia Lee Rd
- 3083 Elbern Ave
- 107 Eastmoor Blvd
- 3123 Elbern Ave
- 3075 Elbern Ave
- 120 Eastmoor Blvd