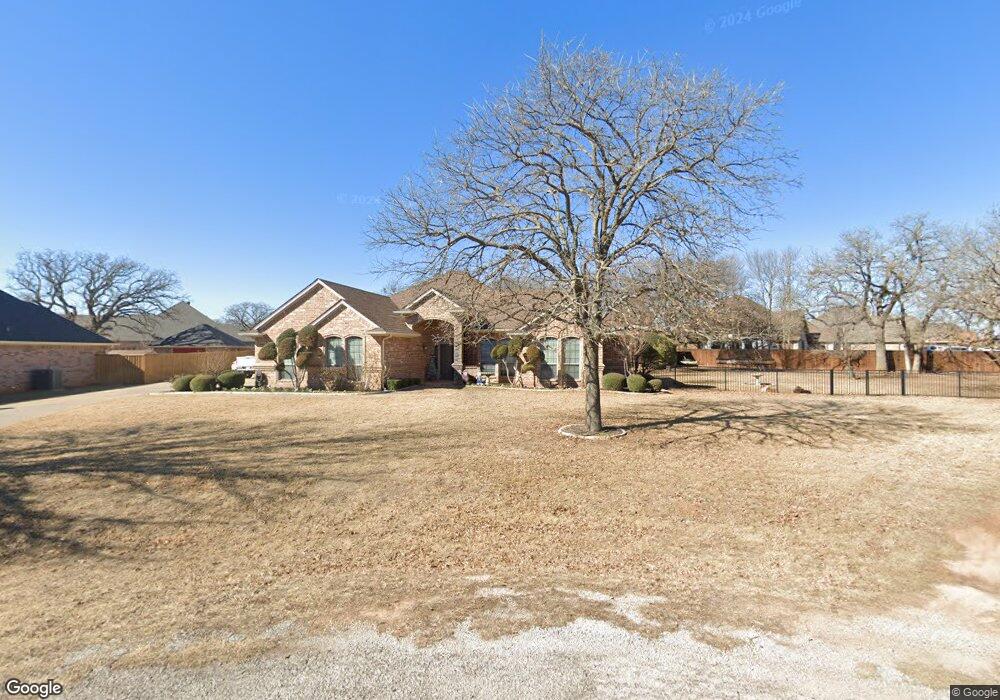
3102 Elkton Ct Granbury, TX 76049
Estimated Value: $511,671 - $599,000
3
Beds
3
Baths
2,945
Sq Ft
$185/Sq Ft
Est. Value
About This Home
This home is located at 3102 Elkton Ct, Granbury, TX 76049 and is currently estimated at $543,668, approximately $184 per square foot. 3102 Elkton Ct is a home located in Hood County with nearby schools including Acton Elementary School, Acton Middle School, and Granbury High School.
Ownership History
Date
Name
Owned For
Owner Type
Purchase Details
Closed on
Oct 27, 2021
Sold by
Myrna M Thompson Trust and Thompson Casi Carnell
Bought by
Thompson Casi Carnell
Current Estimated Value
Purchase Details
Closed on
May 2, 2014
Sold by
Livi O Farrell and Livi Myrna Hompson Revocable
Bought by
Myrna M Thompson Trust #1
Purchase Details
Closed on
Nov 29, 2010
Sold by
Pederson Gary J and Pederson Gloria
Bought by
Thompson Ofarrell and Thompson Myrna
Purchase Details
Closed on
May 3, 2004
Sold by
Custom Classics Inc
Bought by
Thompson Myrna M Trust Number One
Purchase Details
Closed on
Nov 24, 2003
Sold by
Teelcon Inc
Bought by
Thompson Myrna M Trust Number One
Purchase Details
Closed on
Sep 12, 2003
Sold by
Marley Investments Llp
Bought by
Thompson Myrna M Trust Number One
Purchase Details
Closed on
May 10, 2000
Bought by
Thompson Myrna M Trust Number One
Create a Home Valuation Report for This Property
The Home Valuation Report is an in-depth analysis detailing your home's value as well as a comparison with similar homes in the area
Home Values in the Area
Average Home Value in this Area
Purchase History
| Date | Buyer | Sale Price | Title Company |
|---|---|---|---|
| Thompson Casi Carnell | -- | None Listed On Document | |
| Myrna M Thompson Trust #1 | -- | None Available | |
| Thompson Ofarrell | -- | None Available | |
| Thompson Myrna M Trust Number One | -- | -- | |
| Thompson Myrna M Trust Number One | -- | -- | |
| Thompson Myrna M Trust Number One | -- | -- | |
| Thompson Myrna M Trust Number One | -- | -- |
Source: Public Records
Tax History Compared to Growth
Tax History
| Year | Tax Paid | Tax Assessment Tax Assessment Total Assessment is a certain percentage of the fair market value that is determined by local assessors to be the total taxable value of land and additions on the property. | Land | Improvement |
|---|---|---|---|---|
| 2025 | $5,575 | $564,223 | $45,000 | $555,200 |
| 2024 | $6,241 | $512,930 | $45,000 | $467,930 |
| 2023 | $6,378 | $524,150 | $45,000 | $479,150 |
| 2022 | $6,730 | $505,710 | $30,000 | $475,710 |
| 2021 | $6,106 | $397,720 | $30,000 | $367,720 |
| 2020 | $5,662 | $364,610 | $30,000 | $334,610 |
| 2019 | $5,699 | $350,530 | $30,000 | $320,530 |
| 2018 | $5,205 | $320,180 | $30,000 | $290,180 |
| 2017 | $5,225 | $312,430 | $30,000 | $282,430 |
| 2016 | $5,000 | $298,980 | $30,000 | $268,980 |
| 2015 | $2,974 | $291,390 | $30,000 | $261,390 |
| 2014 | $2,974 | $235,610 | $30,000 | $205,610 |
Source: Public Records
Map
Nearby Homes
- 2925 Willow Ridge Cir
- 2936 Willow Ridge Cir
- 1141 Avery Rd
- 1144 Avery Rd
- 1136 Avery Rd
- 2918 James Rd
- 3218 Fountain Way
- 4920 Centre Ct
- 3510 Fountain Way
- 4512 Cimmaron Trail
- 4363 Acton Hwy
- 4410 Halo Ct
- 3207 Hummingbird Ct
- 5003 Bueno Dr
- 3707 Bob White Dr
- 2445 Bob White Dr
- 5102 Largo Dr
- 3119 Bob White Dr
- 1301 James Rd
- 2180 James Rd
- 3104 Elkton Ct
- 3002 Elkton Dr
- 4706 Stoney Creek Ct
- 3100 Elkton Ct
- 2900 Willow Ridge Cir
- 3000 Elkton Dr
- 4704 Stoney Creek Ct
- 3101 Elkton Ct
- 3103 Elkton Ct
- 2902 Willow Ridge Cir
- 4707 Stoney Creek Ct
- 4705 Stoney Creek Ct
- 4702 Stoney Creek Ct
- 3200 Golden Oaks Cir
- 2836 Willow Ridge Cir
- 3102 Marble Ct
- 2904 Willow Ridge Cir
- 2901 Willow Ridge Cir
- 3100 Marble Ct
- 4703 Stoney Creek Ct