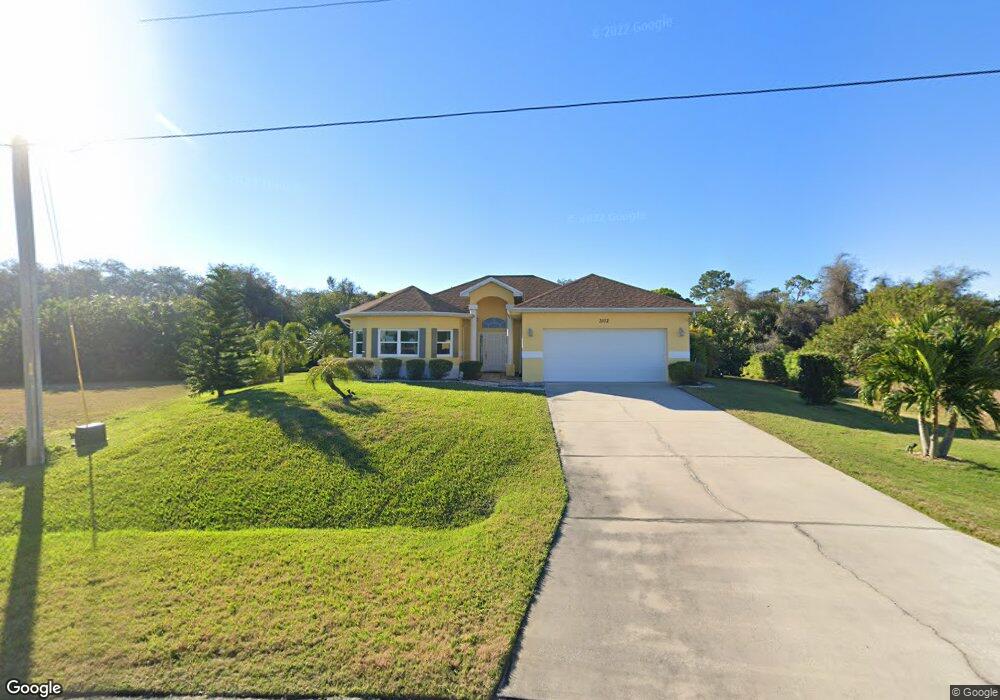
3102 NW 18th Terrace Unit 57 Cape Coral, FL 33993
Burnt Store NeighborhoodEstimated Value: $389,000 - $597,000
3
Beds
2
Baths
2,588
Sq Ft
$184/Sq Ft
Est. Value
About This Home
This home is located at 3102 NW 18th Terrace Unit 57, Cape Coral, FL 33993 and is currently estimated at $476,685, approximately $184 per square foot. 3102 NW 18th Terrace Unit 57 is a home located in Lee County with nearby schools including Dr. Carrie D. Robinson Littleton Elementary School, Tropic Isles Elementary School, and Caloosa Elementary School.
Ownership History
Date
Name
Owned For
Owner Type
Purchase Details
Closed on
Jan 14, 2011
Sold by
Perera Jorge L and Perera Mariela
Bought by
Steindl Josef Peter and Steindl Monika
Current Estimated Value
Purchase Details
Closed on
Dec 20, 2006
Sold by
Marks Bruno and Marks Carmen
Bought by
Perera Jorge L and Perera Mariela
Home Financials for this Owner
Home Financials are based on the most recent Mortgage that was taken out on this home.
Original Mortgage
$325,850
Interest Rate
6.37%
Mortgage Type
Construction
Purchase Details
Closed on
Sep 18, 2002
Sold by
Wienert Michael and Wienert Gabriele
Bought by
Marks Bruno and Marks Carmen
Purchase Details
Closed on
Jul 10, 2002
Sold by
Lupresto Joyce and Lupresto James
Bought by
Wienert Michael and Wienert Gabriele
Create a Home Valuation Report for This Property
The Home Valuation Report is an in-depth analysis detailing your home's value as well as a comparison with similar homes in the area
Home Values in the Area
Average Home Value in this Area
Purchase History
| Date | Buyer | Sale Price | Title Company |
|---|---|---|---|
| Steindl Josef Peter | $105,000 | Attorney | |
| Perera Jorge L | $65,000 | Priority One Title Llc | |
| Marks Bruno | $35,000 | -- | |
| Wienert Michael | $17,900 | -- |
Source: Public Records
Mortgage History
| Date | Status | Borrower | Loan Amount |
|---|---|---|---|
| Previous Owner | Perera Jorge L | $325,850 |
Source: Public Records
Tax History Compared to Growth
Tax History
| Year | Tax Paid | Tax Assessment Tax Assessment Total Assessment is a certain percentage of the fair market value that is determined by local assessors to be the total taxable value of land and additions on the property. | Land | Improvement |
|---|---|---|---|---|
| 2025 | $7,121 | $364,851 | -- | -- |
| 2024 | $6,097 | $331,683 | -- | -- |
| 2023 | $6,097 | $301,530 | $0 | $0 |
| 2022 | $5,586 | $274,118 | $0 | $0 |
| 2021 | $4,978 | $249,198 | $15,103 | $234,095 |
| 2020 | $4,854 | $233,361 | $14,000 | $219,361 |
| 2019 | $4,472 | $213,973 | $14,700 | $199,273 |
| 2018 | $4,599 | $216,418 | $14,700 | $201,718 |
| 2017 | $4,758 | $220,445 | $14,000 | $206,445 |
| 2016 | $4,559 | $209,411 | $15,008 | $194,403 |
| 2015 | $4,602 | $210,302 | $15,025 | $195,277 |
| 2014 | $4,454 | $214,387 | $13,607 | $200,780 |
| 2013 | -- | $188,319 | $16,585 | $171,734 |
Source: Public Records
Map
Nearby Homes
- 1812 NW 30th Place
- 1816 NW 30th Place
- 1806 NW 31st Place
- 2928 NW 18th Terrace
- 2922 NW 19th St
- 1826 NW 31st Place
- 3101 NW 17th Ln
- 3123 NW 17 Ln
- 3123 NW 17th Ln
- 2908 NW 19th St
- 1716 Burnt Store Rd N
- 1720 Burnt Store Rd N
- 2909 NW 19th Terrace
- 1813 NW 32nd Place
- 1633 NW 31st Place
- 100 Burnt Store Rd
- 2933 Van Buren Pkwy
- 1821 NW 29th Ave
- 1802 NW 32nd Place
- 1623 NW 31st Ave
- 1801 NW 31st Ave
- 3106 NW 18th Terrace
- 1803 NW 31st Ave
- 1800 NW 31st Ave
- 3110 NW 18th Terrace
- 1807 NW 31st Ave
- 1801 NW 31st Place
- 3114 NW 18th Terrace Unit 5
- 3114 NW 18th Terrace
- 1811 NW 31st Ave
- 1805 NW 31st Place
- 1800 NW 30th Place
- 1810 NW 31st Place
- 1810 NW 31st Ave
- 1815 NW 31st Ave
- 1802 NW 31st Place
- 1811 NW 31st Place
- 3122 NW 18th Terrace
- 1808 NW 30th Place
- 1819 NW 31st Ave Unit 23+24