NOT LISTED FOR SALE

3102 S Allis St Unit 1 Springfield, IL 62703

Estimated Value: $81,000 - $114,000

2 Beds
1 Bath
1,068 Sq Ft
$88/Sq Ft Est. Value

Last Sold May 27, 2016

Last sale price $83,000 $78 Per Sq Ft

Est. 13% increase in value since last sale

Current estimated payment $652/month

70 Days on Market

Highlights

  • Deck
  • <<bathWSpaHydroMassageTubToken>>
  • Fenced Yard
  • Ranch Style House

About This Home

As of May 2016

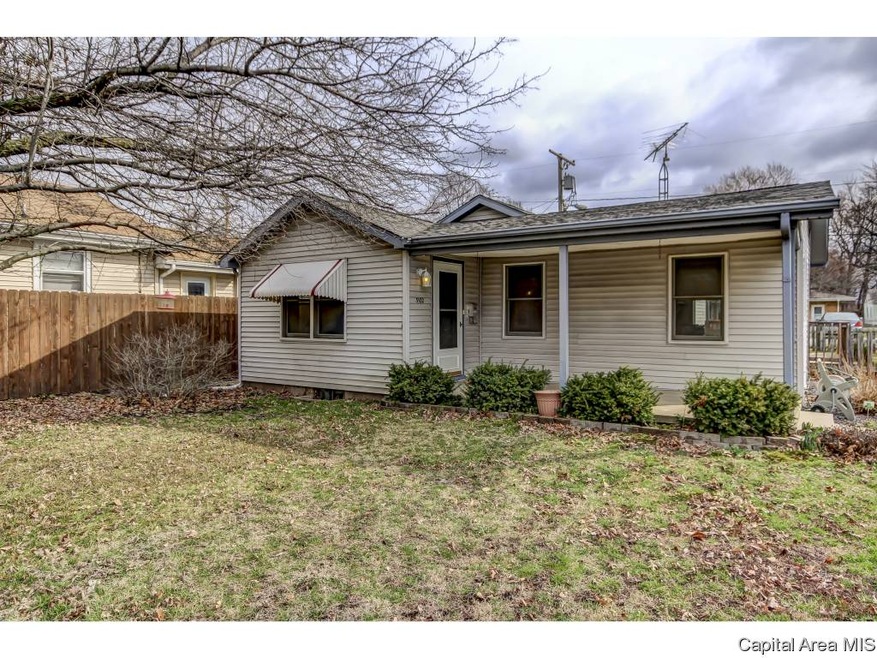
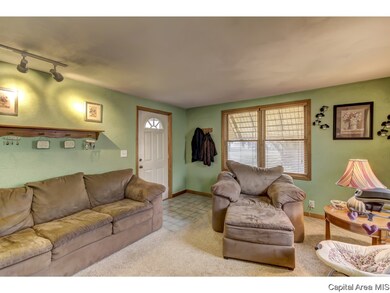
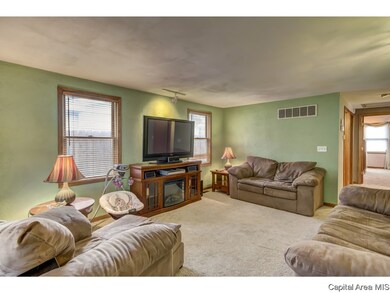
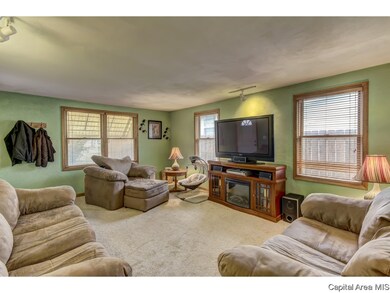
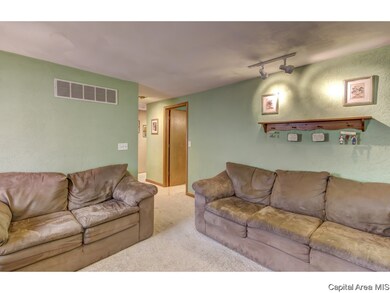
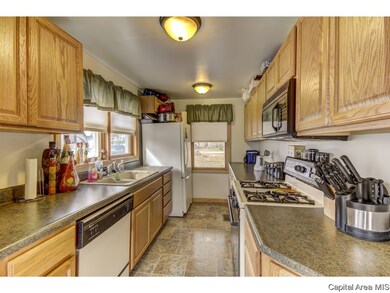
DON'T MISS THIS ADORABLE MOVE IN READY HOME, NEW ROOF, FURNACE, BEAUTIFULLY UPDATED MASTER ON-SUITE OFFERS WHIRLPOOL TUB & WALK IN CLOSET, NEWLY RENOVATED KITCHEN IN 2010, NEW COUNTERTOPS, FLOORING & SCHROCK CABINETS, NEW HOT WATER HEATER IN 08, NEW CARPET, ANDERSON WINDOWS, WHOLE HOUSE FAN & SPACIOUS FENCED BACKYARD. SELLER OFFERING 13-MONTH HOME WARRANTY. WELL MAINTAINED, MOVE IN READY HOME, AT A GREAT PRICE POINT!

Last Agent to Sell the Property

Lori Smith

RE/MAX Professionals License #475140525 Listed on: 03/08/2016

RE/MAX Professionals

Last Buyer's Agent

Cody Huson

The Real Estate Group, Inc. License #475137558

The Real Estate Group, Inc.

Home Details

Home Type

  • Single Family

Est. Annual Taxes

  • $1,117

Lot Details

  • 8,756

Home Design

  • Ranch Style House

Kitchen

  • Oven or Range
  • Dishwasher
  • Disposal

Bedrooms and Bathrooms

  • 1 Full Bathroom
  • <<bathWSpaHydroMassageTubToken>>

Additional Features

  • Deck
  • Fenced Yard
  • Cable TV Available

Home Details

Home Type

Single Family

Est. Annual Taxes

$1,117

Lot Details

0

Listing Details

  • Class: Residential
  • Type: Single Family
  • Style: Ranch
  • Unit Style: 1-Level
  • Legal Description: LOT 12 BLK 8 BELMONT PARK GARDENS EX N 47'
  • Special Features: None
  • Property Sub Type: Detached

Interior Features

  • Appliances: Dishwasher, Disposal, Refrigerator, Range/Oven
  • Interior Amenities: Cable Tv Available, Jetted Tub
  • Total Bathrooms: 2
  • Total Full Baths: 1
  • Total Half Baths: 1
  • Bedrooms: 2
  • Master Bedroom: Dimensions: 15.7x13.3, On Level: Main, Flooring: Carpet
  • Basement Foundation: Crawl Space, Partial, Block
  • Bedroom 2: Dimensions: 11.4x9.4, On Level: Main, Flooring: Carpet
  • Formal Dining Room: Dimensions: 12.11x7.2, On Level: Main, Flooring: Vinyl
  • Kitchen: Dimensions: 11.7x7.4, On Level: Main, Flooring: Vinyl
  • Laundry: On Level: Basement
  • Living Room: Dimensions: 17.4x13, On Level: Main, Flooring: Carpet
  • Total Basement Sq Ft: 810
  • Price Per Sq Ft: 77.72
  • Finished Sq Ft: 1068
  • Total Sq Ft: 1068
  • Finished Main Level Sq Ft: 1068

Exterior Features

  • Exterior: Vinyl Siding
  • Exterior Amenities: Deck, Fenced Yard

Garage/Parking

  • Garage Parking: Detached
  • Number Cars: 1

Utilities

  • Heating Cooling: Gas, Forced Air, Central Air
  • Water Sewer: Public Water, Public Sewer
  • Utility Companies: Cwlp

Schools

  • High School: Springfield District #186

Lot Info

  • Estimated Lot Size: 63.74X138.07
  • Geo Subdivision: IL

Tax Info

  • Annual Taxes: 1117
  • Parcel Id Number Tax Id: 22100480020
  • Tax Exemptions: Homestead Improvement
  • Tax Year: 2015

MLS Schools

  • High School School District: Springfield District #186

Ownership History

Date Name Owned For Owner Type

Purchase Details

Closed on
Sep 22, 2005
Current Estimated Value
$93,581

Purchase Details

Closed on
Oct 19, 2004

Purchase Details

Closed on
Feb 17, 1998

Purchase Details

Closed on
Jul 12, 1986
Source: Public Records

Range of Values:

Collateral Analytics

Collateral Analytics Collateral Analytics AVMs (Automated Valuation Model) employ a number of statistical approaches combined with neighborhood-specific comparable selection guarantees the most up-to-date and precise valuations.

Not Available

Collateral Analytics does not have data for the current month. Please view the chart for historical values.

ICE

ICE Mortgage Technology ICE Mortgage Technology’s AVM (Automated Valuation Model) is a state-of-the-art online residential property valuation tool that provides a quick and accurate estimate of the value of almost any home in the U.S.

Not Available

ICE Mortgage Technology does not have data for the current month. Please view the chart for historical values.

First American

First American First American Data & Analytics’ next-generation AVM combines unrivaled data assets with a blended ensemble of valuation models to produce highly accurate, reliable valuations you can trust.

Not Available

First American does not have data for the current month. Please view the chart for historical values.

Quantarium

Quantarium Quantarium’s valuation service, repeatedly proven the industry’s most accurate and comprehensive, is supercharged with a self-learning and auto-tuning AI engine that continually becomes smarter and more accurate as it processes daily inputs from the industry’s leading RE data lake.

Not Available

Quantarium does not have data for the current month. Please view the chart for historical values.

Average Value
Not Available
List Price
Sold Price
Create a Home Valuation Report for This Property
The Home Valuation Report is an in-depth analysis detailing your home's value as well as a comparison with similar homes in the area

Home Values in the Area

Source: Public Records

Average Home Value in this Area


Source: Public Records

Purchase History

Date Buyer Sale Price Title Company
-- $73,500 --
-- $72,000 --
-- -- --
-- $21,700 --
Source: Public Records

Property History

Date Event Price Change Sq Ft Price
05/27/2016 05/27/16 Sold $83,000 -1.2% $78 / Sq Ft
05/17/2016 05/17/16 Pending -- -- --
03/08/2016 03/08/16 For Sale $84,000 -- $79 / Sq Ft
Source: RMLS Alliance

Tax History Compared to Growth

Source: Public Records

Tax History

Year Tax Paid Tax Assessment Tax Assessment Total Assessment is a certain percentage of the fair market value that is determined by local assessors to be the total taxable value of land and additions on the property. Land Improvement
2024 $1,619 $26,101 $6,747 $19,354
2023 $1,550 $24,167 $6,247 $17,920
2022 $1,459 $22,870 $5,912 $16,958
2021 $1,393 $21,973 $5,680 $16,293
2020 $1,338 $21,734 $5,618 $16,116
2019 $1,281 $21,354 $5,520 $15,834
2018 $1,235 $21,262 $5,496 $15,766
2017 $1,198 $20,936 $5,412 $15,524
2016 $1,149 $20,395 $5,272 $15,123
2015 $1,117 $19,935 $5,153 $14,782
2014 $1,094 $19,769 $5,110 $14,659
2013 $1,082 $19,981 $5,165 $14,816
Source: Public Records

Agents Affiliated with this Home

  • Section Image
  • Section Image
See All Agents

Map

Source: RMLS Alliance

MLS Number: RMACA161236

RMLS Alliance

APN: 22-10.0-480-020