Estimated Value: $346,000 - $423,000
6
Beds
3
Baths
2,644
Sq Ft
$145/Sq Ft
Est. Value
About This Home
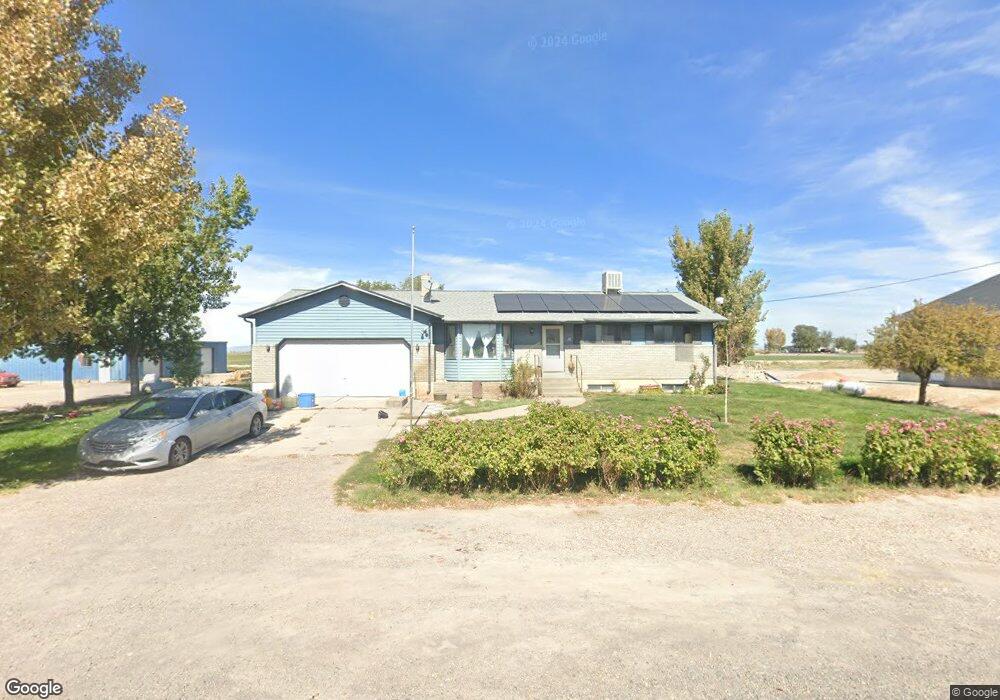
This home is located at 3102 W 2700 N, Delta, UT 84624 and is currently estimated at $382,738, approximately $144 per square foot. 3102 W 2700 N is a home located in Millard County.
Ownership History
Date
Name
Owned For
Owner Type
Purchase Details
Closed on
Aug 27, 2021
Sold by
Stewart Abbott Mary
Bought by
E Vance Abbott Family Inter Vivos Revocable T
Current Estimated Value
Home Financials for this Owner
Home Financials are based on the most recent Mortgage that was taken out on this home.
Original Mortgage
$332,828
Outstanding Balance
$301,525
Interest Rate
2.8%
Mortgage Type
New Conventional
Estimated Equity
$81,213
Purchase Details
Closed on
Aug 19, 2021
Sold by
Fraughton Mary Ann Abbott
Bought by
Rowley Derrick
Home Financials for this Owner
Home Financials are based on the most recent Mortgage that was taken out on this home.
Original Mortgage
$332,828
Outstanding Balance
$301,525
Interest Rate
2.8%
Mortgage Type
New Conventional
Estimated Equity
$81,213
Purchase Details
Closed on
Jan 10, 2011
Sold by
Abbott Edward Vance and Abbott Mary
Bought by
Abbott Edward Vance and Abbott Mary
Create a Home Valuation Report for This Property
The Home Valuation Report is an in-depth analysis detailing your home's value as well as a comparison with similar homes in the area
Home Values in the Area
Average Home Value in this Area
Purchase History
| Date | Buyer | Sale Price | Title Company |
|---|---|---|---|
| E Vance Abbott Family Inter Vivos Revocable T | -- | -- | |
| E Vance Abbott Family Inter Vi | -- | -- | |
| Rowley Derrick | -- | First American Title Insuran | |
| Rowley Derrick | -- | None Available | |
| Abbott Edward Vance | -- | -- |
Source: Public Records
Mortgage History
| Date | Status | Borrower | Loan Amount |
|---|---|---|---|
| Open | E Vance Abbott Family Inter Vi | $332,828 | |
| Closed | E Vance Abbott Family Inter Vivos Revocable T | $332,828 | |
| Closed | Rowley Derrick | $332,828 |
Source: Public Records
Tax History Compared to Growth
Tax History
| Year | Tax Paid | Tax Assessment Tax Assessment Total Assessment is a certain percentage of the fair market value that is determined by local assessors to be the total taxable value of land and additions on the property. | Land | Improvement |
|---|---|---|---|---|
| 2025 | $1,769 | $217,884 | $19,750 | $198,134 |
| 2024 | $1,769 | $222,262 | $14,250 | $208,012 |
| 2023 | $2,002 | $222,262 | $14,250 | $208,012 |
| 2022 | $1,585 | $140,437 | $14,250 | $126,187 |
| 2021 | $1,301 | $111,244 | $12,600 | $98,644 |
| 2020 | $462 | $107,262 | $12,600 | $94,662 |
| 2019 | $410 | $101,387 | $12,600 | $88,787 |
| 2018 | $1,041 | $92,785 | $12,600 | $80,185 |
| 2017 | $56 | $89,485 | $9,300 | $80,185 |
| 2016 | $164 | $89,485 | $9,300 | $80,185 |
| 2015 | $53 | $89,485 | $9,300 | $80,185 |
| 2014 | -- | $89,485 | $9,300 | $80,185 |
| 2013 | -- | $83,386 | $9,300 | $74,086 |
Source: Public Records
Map
Nearby Homes
- 9000 W 1500 Rd N
- 4340 W 5000 N
- 700 Acres
- 1500 S 10000 W
- 6000 N 10000 W
- 700 Acres Hwy 6 & Main St (Hwy 50)
- 2000 E 10500 N
- 6200 S 3000 W
- 98 W 1000 N
- 451 W 300 N
- 331 W 200 N
- 325 N 100 W
- 435 W 100 S
- 242 S 400 W
- 163 W 100 S
- 294 S 300 W
- 901 E 750 Rd N
- 0 E Highway 6 Unit LotWP001 16586023
- 328 S Center St
- 7154 N 3000 W