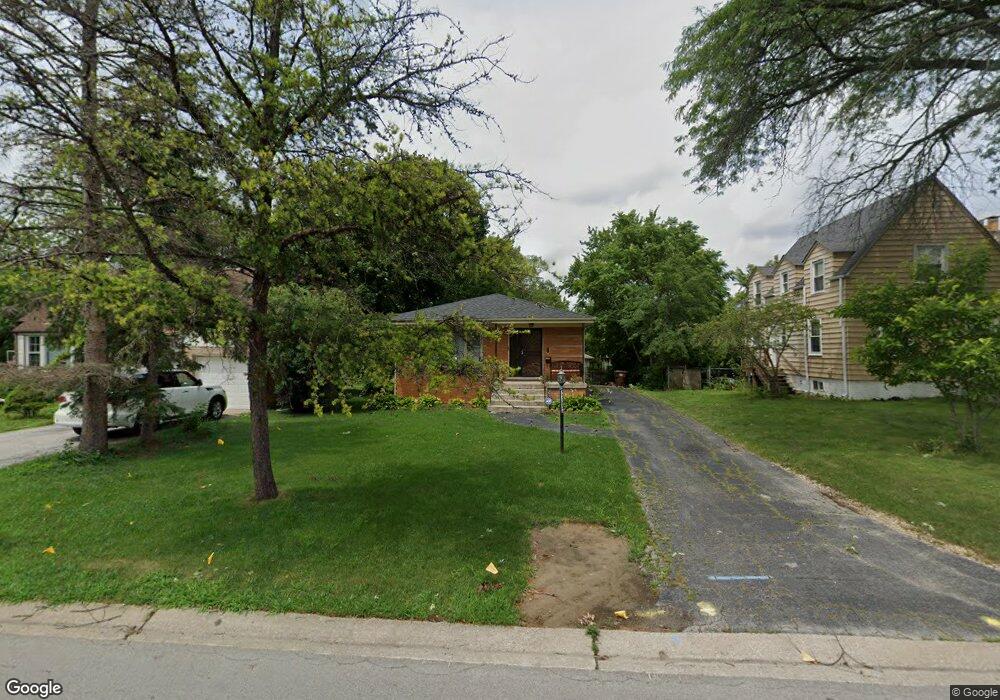
3102 Woodworth Place Hazel Crest, IL 60429
Estimated Value: $187,000 - $241,000
3
Beds
2
Baths
1,296
Sq Ft
$163/Sq Ft
Est. Value
About This Home
This home is located at 3102 Woodworth Place, Hazel Crest, IL 60429 and is currently estimated at $211,785, approximately $163 per square foot. 3102 Woodworth Place is a home located in Cook County with nearby schools including Mae Jemison School, Prairie-Hills Junior High School, and Hillcrest High School.
Ownership History
Date
Name
Owned For
Owner Type
Purchase Details
Closed on
Jun 7, 2006
Sold by
Citimortgage Inc
Bought by
Cooks Anthony R and Cook Latasha S
Current Estimated Value
Home Financials for this Owner
Home Financials are based on the most recent Mortgage that was taken out on this home.
Original Mortgage
$149,900
Outstanding Balance
$88,670
Interest Rate
6.68%
Mortgage Type
Unknown
Estimated Equity
$123,115
Purchase Details
Closed on
Dec 16, 2005
Sold by
Farag Mamdouh M
Bought by
Citimortgage Inc
Purchase Details
Closed on
Feb 10, 2003
Sold by
Johnson Kenneth R and Johnson Gwendolyn
Bought by
Farag Mamdouh M
Home Financials for this Owner
Home Financials are based on the most recent Mortgage that was taken out on this home.
Original Mortgage
$124,450
Interest Rate
5.86%
Create a Home Valuation Report for This Property
The Home Valuation Report is an in-depth analysis detailing your home's value as well as a comparison with similar homes in the area
Home Values in the Area
Average Home Value in this Area
Purchase History
| Date | Buyer | Sale Price | Title Company |
|---|---|---|---|
| Cooks Anthony R | $150,000 | First American Title | |
| Citimortgage Inc | -- | None Available | |
| Farag Mamdouh M | $131,000 | Atgf Inc | |
| Farag Mamdouh M | $131,000 | Atgf Inc |
Source: Public Records
Mortgage History
| Date | Status | Borrower | Loan Amount |
|---|---|---|---|
| Open | Cooks Anthony R | $149,900 | |
| Previous Owner | Farag Mamdouh M | $124,450 |
Source: Public Records
Tax History Compared to Growth
Tax History
| Year | Tax Paid | Tax Assessment Tax Assessment Total Assessment is a certain percentage of the fair market value that is determined by local assessors to be the total taxable value of land and additions on the property. | Land | Improvement |
|---|---|---|---|---|
| 2024 | $7,522 | $18,000 | $2,161 | $15,839 |
| 2023 | $4,610 | $18,000 | $2,161 | $15,839 |
| 2022 | $4,610 | $9,702 | $1,829 | $7,873 |
| 2021 | $4,507 | $9,700 | $1,828 | $7,872 |
| 2020 | $4,432 | $9,700 | $1,828 | $7,872 |
| 2019 | $4,171 | $9,659 | $1,662 | $7,997 |
| 2018 | $4,038 | $9,659 | $1,662 | $7,997 |
| 2017 | $3,809 | $9,659 | $1,662 | $7,997 |
| 2016 | $3,227 | $8,017 | $1,496 | $6,521 |
| 2015 | $3,021 | $8,017 | $1,496 | $6,521 |
| 2014 | $3,745 | $9,423 | $1,496 | $7,927 |
| 2013 | $4,258 | $11,521 | $1,496 | $10,025 |
Source: Public Records
Map
Nearby Homes
- 3124 173rd St
- 3004 Longfellow Ave
- 17303 Kedzie Ave
- 3003 Longfellow Ave
- 3012 171st St Unit 2E
- 3012 171st St Unit GT
- 3213 Woodworth Place
- 3107 Longfellow Ave
- 17410 Emerson Ave
- 17007 Albany Ave Unit T106
- 17005 Albany Ave Unit 102
- 17005 Albany Ave Unit 202
- 17006 Novak Dr Unit 101
- 17006 Novak Dr Unit 102
- 3205 Oak Ct
- 17107 Longfellow Ave
- 2818 Tennyson Place
- 17405 Longfellow Ave
- 17000 Novak Dr Unit 105
- 17311 Burr Oak Ln
- 3100 Woodworth Place
- 3100 Woodworth Place
- 3136 Woodworth Place
- 3106 Woodworth Place
- 3110 Woodworth Place
- 3107 172nd St
- 3103 172nd St
- 3109 172nd St
- 3101 172nd St
- 3103 Woodworth Place
- 3111 172nd St
- 3105 Woodworth Place
- 3107 Woodworth Place
- 3004 Woodworth Place
- 3113 172nd St
- 3111 Woodworth Place
- 3015 Woodworth Place
- 3001 172nd St Unit 3003
- 3002 Woodworth Place
- 3116 Woodworth Place