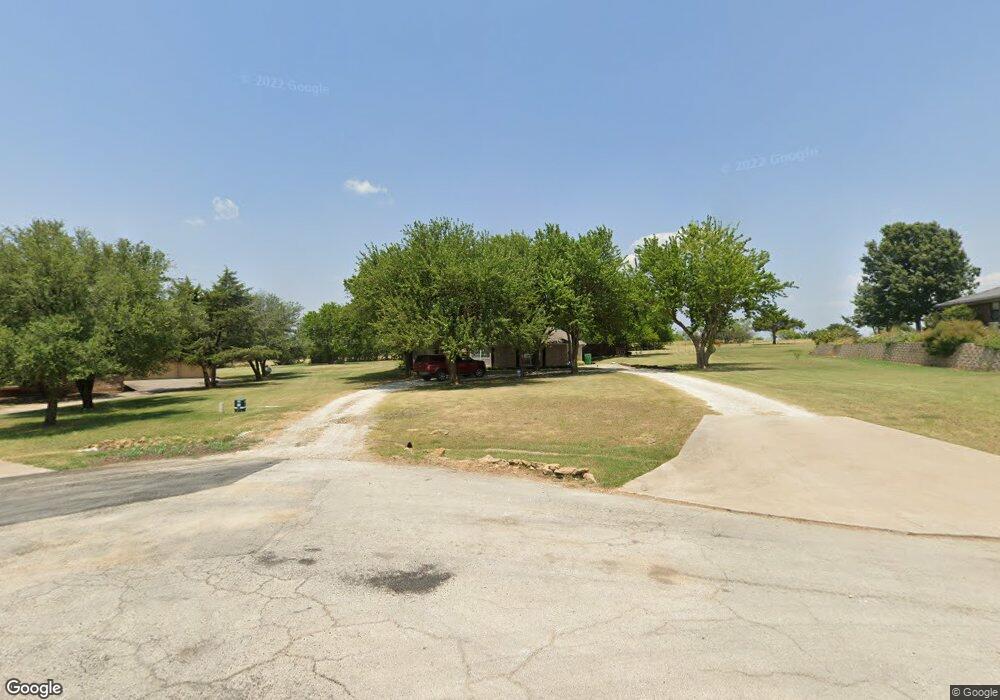
3103 Briarcliff Cir Gainesville, TX 76240
Estimated Value: $387,000 - $487,000
3
Beds
2
Baths
2,198
Sq Ft
$204/Sq Ft
Est. Value
About This Home
This home is located at 3103 Briarcliff Cir, Gainesville, TX 76240 and is currently estimated at $449,337, approximately $204 per square foot. 3103 Briarcliff Cir is a home located in Cooke County with nearby schools including Edison Elementary School, W.E. Chalmers Elementary School, and Gainesville Jr. High School.
Ownership History
Date
Name
Owned For
Owner Type
Purchase Details
Closed on
Jun 9, 2020
Sold by
Fleming John S and Fleming Rona C
Bought by
Johnson Arden and Johnson Lisa G
Current Estimated Value
Home Financials for this Owner
Home Financials are based on the most recent Mortgage that was taken out on this home.
Original Mortgage
$283,000
Outstanding Balance
$249,747
Interest Rate
3.2%
Mortgage Type
VA
Estimated Equity
$199,590
Purchase Details
Closed on
Jun 30, 2017
Sold by
Perry Debbie
Bought by
Fleming John S and Fleming Rona C
Home Financials for this Owner
Home Financials are based on the most recent Mortgage that was taken out on this home.
Original Mortgage
$250,381
Interest Rate
4.02%
Mortgage Type
New Conventional
Purchase Details
Closed on
Jun 3, 2016
Sold by
Lewis Daniel E
Bought by
Perry Debbie
Home Financials for this Owner
Home Financials are based on the most recent Mortgage that was taken out on this home.
Original Mortgage
$192,000
Interest Rate
3.59%
Mortgage Type
New Conventional
Purchase Details
Closed on
Feb 21, 2007
Sold by
Lopez Juan and Lopez Babette
Bought by
Lewis Daniel E
Create a Home Valuation Report for This Property
The Home Valuation Report is an in-depth analysis detailing your home's value as well as a comparison with similar homes in the area
Home Values in the Area
Average Home Value in this Area
Purchase History
| Date | Buyer | Sale Price | Title Company |
|---|---|---|---|
| Johnson Arden | -- | Txprem | |
| Fleming John S | -- | Howeth Title Company | |
| Perry Debbie | -- | None Available | |
| Lewis Daniel E | -- | -- |
Source: Public Records
Mortgage History
| Date | Status | Borrower | Loan Amount |
|---|---|---|---|
| Open | Johnson Arden | $283,000 | |
| Previous Owner | Fleming John S | $250,381 | |
| Previous Owner | Perry Debbie | $192,000 |
Source: Public Records
Tax History Compared to Growth
Tax History
| Year | Tax Paid | Tax Assessment Tax Assessment Total Assessment is a certain percentage of the fair market value that is determined by local assessors to be the total taxable value of land and additions on the property. | Land | Improvement |
|---|---|---|---|---|
| 2025 | -- | $408,573 | $81,250 | $339,750 |
| 2024 | $7,039 | $421,000 | $81,250 | $339,750 |
| 2023 | $6,625 | $337,664 | $65,000 | $333,915 |
| 2022 | $6,683 | $360,005 | $50,000 | $310,005 |
| 2021 | $7,186 | $279,061 | $27,500 | $251,561 |
| 2020 | $7,703 | $290,068 | $27,500 | $262,568 |
| 2019 | $7,556 | $276,469 | $24,000 | $252,469 |
| 2018 | $6,864 | $251,548 | $24,000 | $227,548 |
| 2017 | $6,046 | $222,374 | $17,000 | $205,374 |
| 2015 | $5,601 | $212,439 | $17,000 | $195,439 |
| 2014 | $5,601 | $210,465 | $17,000 | $193,465 |
Source: Public Records
Map
Nearby Homes
- 3100 Briarcliff Cir
- 3102 Woodland Ct
- 712 Stoneridge Dr
- 700 Juneau St
- 3406 Helena St
- 3515 Helena St
- Big Cypress II Plan at Liberty Pointe
- San Gabriel II Plan at Liberty Pointe
- 3502 Helena St
- 3508 Helena St
- San Saba III Plan at Liberty Pointe
- Cascade II Plan at Liberty Pointe
- 3500 Helena St
- 3511 Helena St
- Havasu III Plan at Liberty Pointe
- Nueces Plan at Liberty Pointe
- 3513 Helena St
- Navasota Plan at Liberty Pointe
- 3505 Helena St
- Lavon Plan at Liberty Pointe
- 3105 Briarcliff Cir
- 3101 Briarcliff Cir
- 3107 Briarcliff Cir
- 3106 Briarcliff Cir
- 3109 Briarcliff Cir
- 3108 Briarcliff Cir
- 3103 Woodland Ct
- 3105 Woodland Ct
- 3111 Briarcliff Cir
- 701 Stone Ridge Dr
- 3107 Woodland Ct
- 3200 Briarcliff Cir
- 3113 Woodland Ct
- 14 Woodland Ct
- Lot 10 Woodland Ct
- Lot 15 Woodland Ct
- Lot 16 Woodland Ct
- Lot 11 Woodland Ct
- Lot 12 Woodland Ct
- Lot 13 Woodland Ct