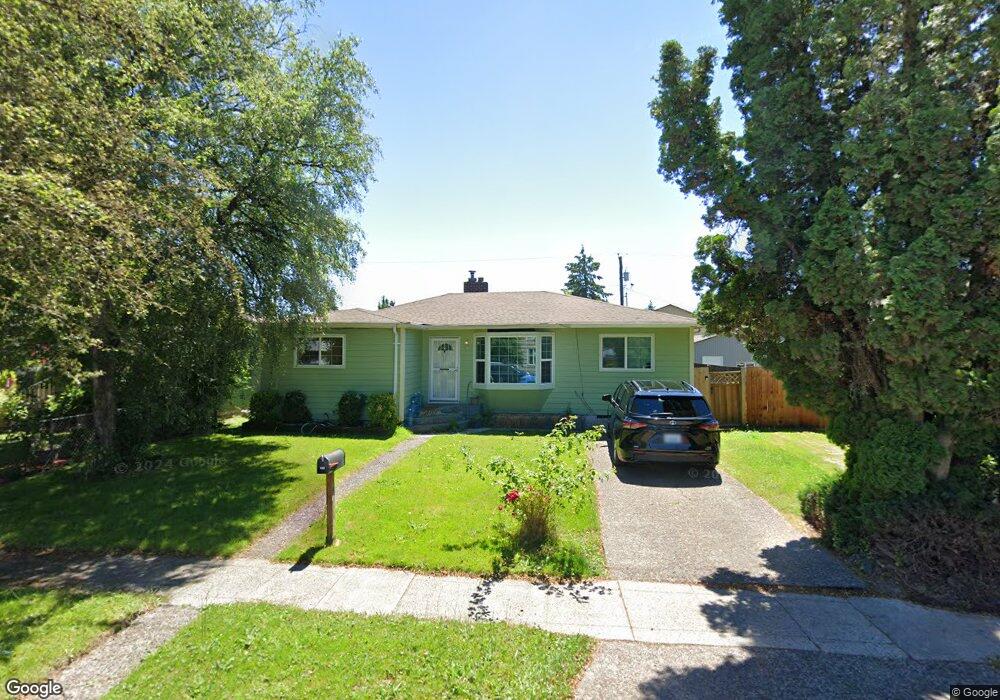
3103 Fir St Longview, WA 98632
Olympic West NeighborhoodEstimated Value: $324,000 - $362,000
2
Beds
1
Bath
1,266
Sq Ft
$268/Sq Ft
Est. Value
About This Home
This home is located at 3103 Fir St, Longview, WA 98632 and is currently estimated at $339,623, approximately $268 per square foot. 3103 Fir St is a home located in Cowlitz County with nearby schools including Olympic Elementary School, Monticello Middle School, and R.A. Long High School.
Ownership History
Date
Name
Owned For
Owner Type
Purchase Details
Closed on
Aug 8, 2022
Sold by
Worel Matthew A
Bought by
Worel Matthew A and Worel Natalie M
Current Estimated Value
Home Financials for this Owner
Home Financials are based on the most recent Mortgage that was taken out on this home.
Original Mortgage
$215,000
Outstanding Balance
$181,966
Interest Rate
4.58%
Mortgage Type
New Conventional
Estimated Equity
$157,657
Create a Home Valuation Report for This Property
The Home Valuation Report is an in-depth analysis detailing your home's value as well as a comparison with similar homes in the area
Home Values in the Area
Average Home Value in this Area
Purchase History
| Date | Buyer | Sale Price | Title Company |
|---|---|---|---|
| Worel Matthew A | -- | Fidelity National Title |
Source: Public Records
Mortgage History
| Date | Status | Borrower | Loan Amount |
|---|---|---|---|
| Open | Worel Matthew A | $215,000 |
Source: Public Records
Tax History Compared to Growth
Tax History
| Year | Tax Paid | Tax Assessment Tax Assessment Total Assessment is a certain percentage of the fair market value that is determined by local assessors to be the total taxable value of land and additions on the property. | Land | Improvement |
|---|---|---|---|---|
| 2024 | $2,853 | $329,060 | $39,970 | $289,090 |
| 2023 | $2,717 | $314,300 | $39,970 | $274,330 |
| 2022 | $2,534 | $306,320 | $39,970 | $266,350 |
| 2021 | $2,519 | $254,600 | $38,060 | $216,540 |
| 2020 | $1,989 | $228,010 | $38,060 | $189,950 |
| 2019 | $1,813 | $188,816 | $38,063 | $150,753 |
| 2018 | $1,669 | $168,020 | $38,060 | $129,960 |
| 2017 | $1,442 | $127,000 | $36,230 | $90,770 |
| 2016 | $1,392 | $111,700 | $34,510 | $77,190 |
| 2015 | $1,501 | $110,300 | $34,510 | $75,790 |
| 2013 | -- | $106,220 | $33,500 | $72,720 |
Source: Public Records
Map
Nearby Homes
- 3053 Fir St
- 3019 Fir St
- 3153 Florida St
- 2938 Washington Way
- 3102 Garfield St
- 344 Douglas St
- 2951 Douglas St
- 2947 Douglas St
- 2848 Dover St
- 1109 32nd Ave
- 805 33rd Ave
- 256 Douglas St
- 2902 Garfield St
- 282 Colorado St
- 767 34th Ave
- 278 Colorado St
- 311 Baltimore St
- 307 Baltimore St
- 2727 Hemlock St
- 212 Douglas St