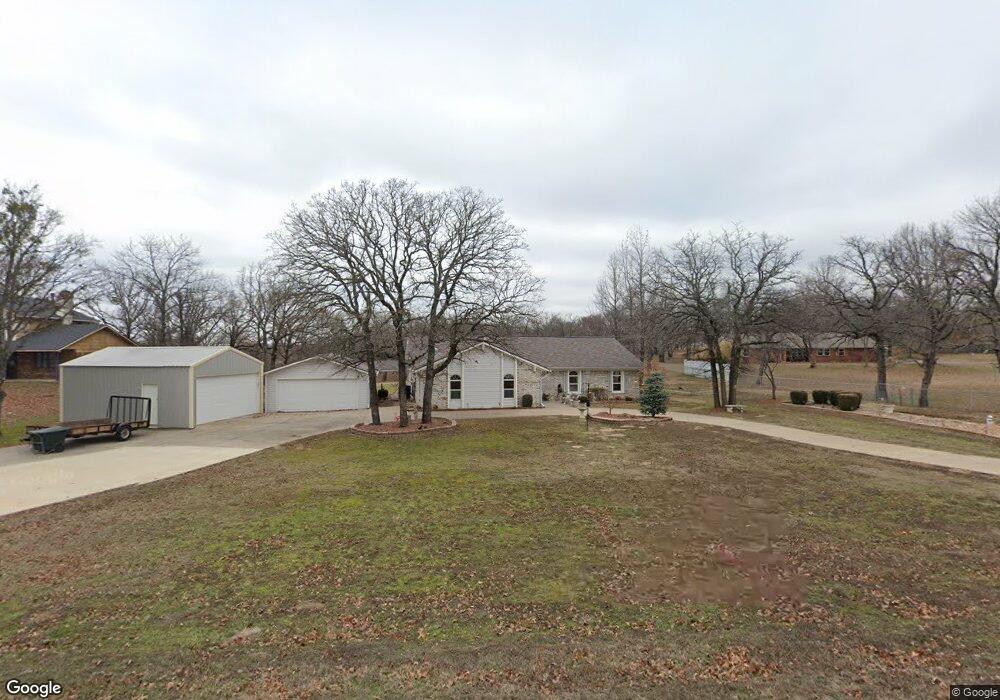
3103 Laurel Oaks Rd Sapulpa, OK 74066
Estimated Value: $312,944 - $370,000
3
Beds
3
Baths
2,091
Sq Ft
$167/Sq Ft
Est. Value
About This Home
This home is located at 3103 Laurel Oaks Rd, Sapulpa, OK 74066 and is currently estimated at $349,736, approximately $167 per square foot. 3103 Laurel Oaks Rd is a home located in Creek County with nearby schools including Sapulpa Middle School, Sapulpa Junior High School, and Sapulpa High School.
Ownership History
Date
Name
Owned For
Owner Type
Purchase Details
Closed on
Feb 25, 2013
Sold by
Barry James T and Barry Suzanne
Bought by
Barry James Thomas and Barry Suzanne Marie
Current Estimated Value
Purchase Details
Closed on
Oct 13, 2011
Sold by
Barry James T and Barry Suzanne
Bought by
Barry James T and Barry Suzanne
Purchase Details
Closed on
Oct 27, 2008
Sold by
Henshaw Robert H and Henshaw Debra Ann
Bought by
Barry James T and Barry Suzanne
Home Financials for this Owner
Home Financials are based on the most recent Mortgage that was taken out on this home.
Original Mortgage
$120,000
Interest Rate
5.83%
Mortgage Type
Credit Line Revolving
Purchase Details
Closed on
May 30, 2006
Sold by
Helton James W and Helton Connie S
Bought by
Henshaw Robert H and Henshaw Debra Ann
Home Financials for this Owner
Home Financials are based on the most recent Mortgage that was taken out on this home.
Original Mortgage
$70,000
Interest Rate
6.58%
Mortgage Type
Future Advance Clause Open End Mortgage
Create a Home Valuation Report for This Property
The Home Valuation Report is an in-depth analysis detailing your home's value as well as a comparison with similar homes in the area
Home Values in the Area
Average Home Value in this Area
Purchase History
| Date | Buyer | Sale Price | Title Company |
|---|---|---|---|
| Barry James Thomas | -- | None Available | |
| Barry James T | -- | -- | |
| Barry James T | $180,000 | None Available | |
| Henshaw Robert H | $156,000 | None Available |
Source: Public Records
Mortgage History
| Date | Status | Borrower | Loan Amount |
|---|---|---|---|
| Previous Owner | Barry James T | $120,000 | |
| Previous Owner | Henshaw Robert H | $70,000 |
Source: Public Records
Tax History Compared to Growth
Tax History
| Year | Tax Paid | Tax Assessment Tax Assessment Total Assessment is a certain percentage of the fair market value that is determined by local assessors to be the total taxable value of land and additions on the property. | Land | Improvement |
|---|---|---|---|---|
| 2025 | $2,505 | $21,604 | $1,760 | $19,844 |
| 2024 | $2,505 | $21,604 | $1,812 | $19,792 |
| 2023 | $2,505 | $21,604 | $1,935 | $19,669 |
| 2022 | $2,367 | $21,605 | $2,061 | $19,544 |
| 2021 | $2,444 | $21,605 | $2,220 | $19,385 |
| 2020 | $2,431 | $21,604 | $2,119 | $19,485 |
| 2019 | $2,442 | $21,604 | $2,313 | $19,291 |
| 2018 | $2,493 | $21,604 | $2,337 | $19,267 |
| 2017 | $2,480 | $21,604 | $2,337 | $19,267 |
| 2016 | $2,358 | $21,604 | $2,337 | $19,267 |
| 2015 | -- | $21,604 | $2,337 | $19,267 |
| 2014 | -- | $21,604 | $2,337 | $19,267 |
Source: Public Records
Map
Nearby Homes
- 3003 Laurel Oaks Rd
- 2721 Raintree Cir
- 2712 Raintree Cir
- 504 Hickory Hill Rd
- 404 Hickory Hill Rd
- 5672 W Hilton Rd
- Lincoln Plan at Hickory Falls
- Country Ridge Plan at Hickory Falls
- Jude TR Plan at Hickory Falls
- Lincoln II Plan at Hickory Falls
- Martine III Plan at Hickory Falls
- Jude FH Plan at Hickory Falls
- Woodland TR Plan at Hickory Falls
- Martine ll Plan at Hickory Falls
- Izzy ll Plan at Hickory Falls
- Izzy II Plan at Hickory Falls
- Creekshire X Plan at Hickory Falls
- Conner II Exp Plan at Hickory Falls
- Dorsey V Plan at Hickory Falls
- Hickory Plan at Hickory Falls
- 3107 Laurel Oaks Rd
- 3020 Laurel Oaks Rd
- 3001 Laurel Oaks Rd
- 0 Laurel Oaks Rd
- 3100 Laurel Oaks Rd
- 3010 Laurel Oaks Rd
- 3111 Laurel Oaks Rd
- 9957 Hickory Hill Rd
- 801 Hickory Hill Rd
- 2999 Laurel Oaks Rd
- 3203 Laurel Oaks Rd
- 745 Hickory Hill Rd
- 820 Laurel Oaks Cir
- 810 Laurel Oaks Cir
- 725 Hickory Hill Rd
- 831 Laurel Oaks Cir
- 705 Hickory Hill Rd
- 6274 Cedar Creek Cir
- 1001 Hickory Hill Rd
- 821 Laurel Oaks Cir