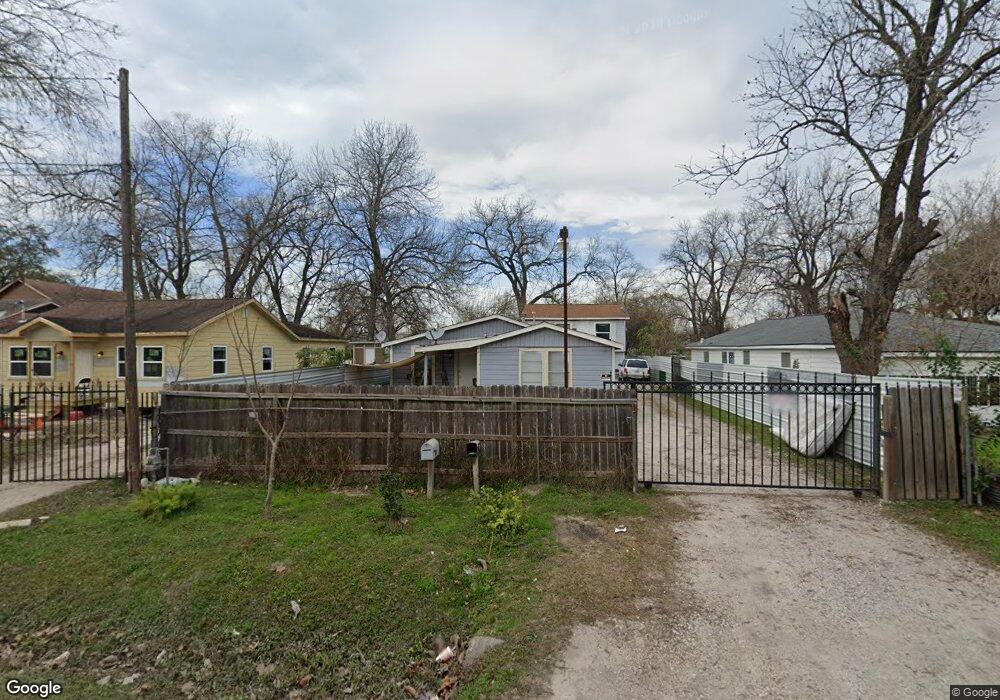
3103 Melbourne St Houston, TX 77026
Eastex-Jensen NeighborhoodEstimated Value: $155,000 - $191,000
2
Beds
1
Bath
1,208
Sq Ft
$141/Sq Ft
Est. Value
About This Home
This home is located at 3103 Melbourne St, Houston, TX 77026 and is currently estimated at $170,319, approximately $140 per square foot. 3103 Melbourne St is a home located in Harris County with nearby schools including Roderick R. Paige Elementary School, Key Middle, and Northside High School.
Ownership History
Date
Name
Owned For
Owner Type
Purchase Details
Closed on
Nov 25, 2014
Sold by
Hernandez Priscilla
Bought by
Alejo Maria Amalia Nolasco and Lopez Osvaldo
Current Estimated Value
Purchase Details
Closed on
Oct 27, 2005
Sold by
Nash Archie and Nash Georgia Marie Terry
Bought by
Dotson Horace
Purchase Details
Closed on
Aug 18, 2005
Sold by
Washington Charles E
Bought by
Dotson Horace N
Purchase Details
Closed on
Sep 15, 1998
Sold by
Nash Archie and Nash Georgia Marie Terry
Bought by
Washington Charles and Washington Gertie
Home Financials for this Owner
Home Financials are based on the most recent Mortgage that was taken out on this home.
Original Mortgage
$20,000
Interest Rate
6.69%
Mortgage Type
Seller Take Back
Purchase Details
Closed on
Apr 27, 1986
Sold by
Dotson Horace
Bought by
Hernandez Priscilla
Create a Home Valuation Report for This Property
The Home Valuation Report is an in-depth analysis detailing your home's value as well as a comparison with similar homes in the area
Home Values in the Area
Average Home Value in this Area
Purchase History
| Date | Buyer | Sale Price | Title Company |
|---|---|---|---|
| Alejo Maria Amalia Nolasco | -- | None Available | |
| Dotson Horace | -- | -- | |
| Dotson Horace N | -- | None Available | |
| Washington Charles | -- | -- | |
| Hernandez Priscilla | -- | None Available |
Source: Public Records
Mortgage History
| Date | Status | Borrower | Loan Amount |
|---|---|---|---|
| Previous Owner | Washington Charles | $20,000 |
Source: Public Records
Tax History Compared to Growth
Tax History
| Year | Tax Paid | Tax Assessment Tax Assessment Total Assessment is a certain percentage of the fair market value that is determined by local assessors to be the total taxable value of land and additions on the property. | Land | Improvement |
|---|---|---|---|---|
| 2025 | $3,066 | $136,556 | $66,625 | $69,931 |
| 2024 | $3,066 | $146,551 | $73,125 | $73,426 |
| 2023 | $3,066 | $144,669 | $73,125 | $71,544 |
| 2022 | $2,454 | $111,470 | $46,313 | $65,157 |
| 2021 | $2,217 | $95,125 | $46,313 | $48,812 |
| 2020 | $1,879 | $77,607 | $24,700 | $52,907 |
| 2019 | $1,922 | $75,972 | $24,180 | $51,792 |
| 2018 | $1,006 | $39,759 | $14,625 | $25,134 |
| 2017 | $1,005 | $39,759 | $14,625 | $25,134 |
| 2016 | $1,005 | $39,759 | $14,625 | $25,134 |
| 2015 | $784 | $30,500 | $13,000 | $17,500 |
| 2014 | $784 | $30,500 | $13,000 | $17,500 |
Source: Public Records
Map
Nearby Homes
- 3016 King St
- 3012 Melbourne St
- 3206 Melbourne St
- 2507 Creston Dr
- 3401 Melbourne St
- 3306 Caplin St
- 3224 Creston Dr
- 3425 King St
- 3429 King St
- 3504 Caplin St Unit C
- 3504 Caplin St Unit D
- 2710 Lynnfield St
- 2513 Melbourne St
- 2707 Lynnfield St
- 6806 Schuller Rd
- 2503 Creston Dr
- 4008 Bennington St
- 2301 King St
- 3210 Oklahoma St
- 2301 Caplin St
- 3105 Melbourne St
- 3017 Melbourne St
- 3107 Melbourne St
- 3011 Melbourne St
- 3024 King St
- 3106 King St
- 3020 King St
- 3009 Melbourne St
- 3111 Melbourne St
- 3112 King St
- 3102 Melbourne St
- 3110 King St
- 3016 Melbourne St
- 3005 Melbourne St
- 3006 King St
- 3006 King St
- 3008 Melbourne St
- 3107 Caplin St
- 3112 Melbourne St
- 3004 King St