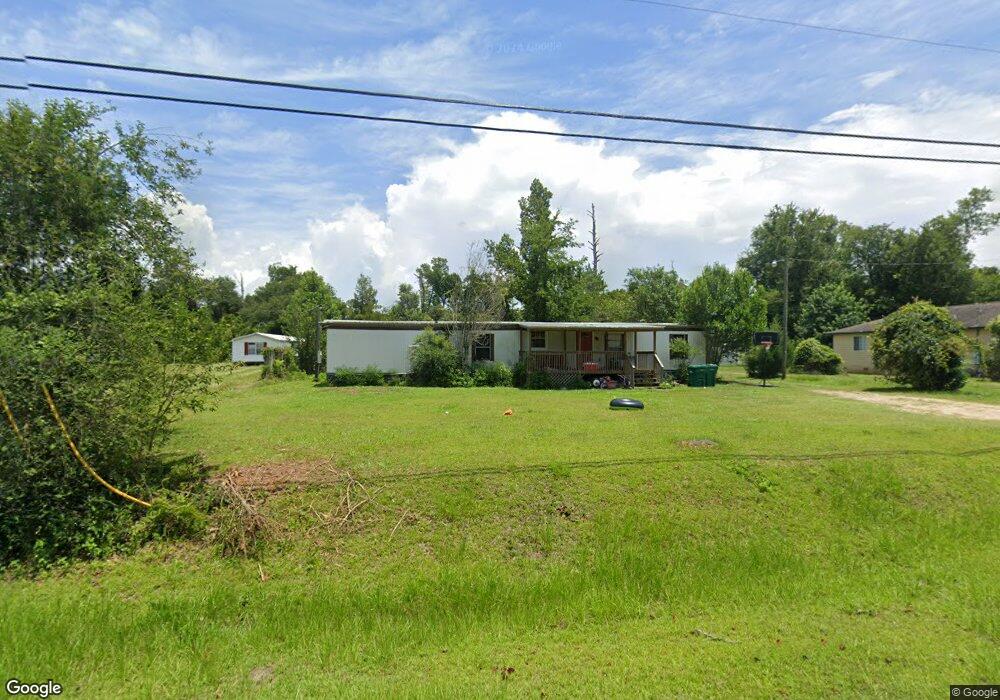
3104 Bump Nose Rd Marianna, FL 32446
Estimated Value: $226,965 - $260,000
4
Beds
2
Baths
1,796
Sq Ft
$137/Sq Ft
Est. Value
About This Home
This home is located at 3104 Bump Nose Rd, Marianna, FL 32446 and is currently estimated at $245,491, approximately $136 per square foot. 3104 Bump Nose Rd is a home located in Jackson County with nearby schools including Marianna K-8 School and Marianna High School.
Ownership History
Date
Name
Owned For
Owner Type
Purchase Details
Closed on
Nov 4, 2016
Sold by
Bell George H and Bell Lorna R
Bought by
Myrick Sarranda Hall and Myrick Curtis
Current Estimated Value
Home Financials for this Owner
Home Financials are based on the most recent Mortgage that was taken out on this home.
Original Mortgage
$102,116
Outstanding Balance
$82,188
Interest Rate
3.5%
Mortgage Type
FHA
Estimated Equity
$163,303
Purchase Details
Closed on
Jul 16, 2015
Sold by
Cr Homes Llc
Bought by
Bell George H and Bell Lorna R
Purchase Details
Closed on
Jan 20, 2015
Sold by
Fannie Mae
Bought by
Cr Homes Llc
Purchase Details
Closed on
Jul 31, 2013
Sold by
Nguyen Khai T and Pnc Mortgage
Bought by
Federal National Mortgage Association
Purchase Details
Closed on
May 3, 2004
Sold by
Nguyen Diem T and Vo Dan Kim
Bought by
Nguyen Khai T
Create a Home Valuation Report for This Property
The Home Valuation Report is an in-depth analysis detailing your home's value as well as a comparison with similar homes in the area
Home Values in the Area
Average Home Value in this Area
Purchase History
| Date | Buyer | Sale Price | Title Company |
|---|---|---|---|
| Myrick Sarranda Hall | $104,000 | Oceanside Title Inc | |
| Bell George H | $19,500 | Oceanside Title Inc | |
| Cr Homes Llc | $17,100 | Bay National Title Company | |
| Federal National Mortgage Association | -- | None Available | |
| Nguyen Khai T | -- | -- |
Source: Public Records
Mortgage History
| Date | Status | Borrower | Loan Amount |
|---|---|---|---|
| Open | Myrick Sarranda Hall | $102,116 |
Source: Public Records
Tax History Compared to Growth
Tax History
| Year | Tax Paid | Tax Assessment Tax Assessment Total Assessment is a certain percentage of the fair market value that is determined by local assessors to be the total taxable value of land and additions on the property. | Land | Improvement |
|---|---|---|---|---|
| 2024 | $815 | $100,846 | -- | -- |
| 2023 | $759 | $97,909 | $0 | $0 |
| 2022 | $680 | $95,057 | $0 | $0 |
| 2021 | $676 | $92,288 | $0 | $0 |
| 2020 | $681 | $91,014 | $4,485 | $86,529 |
| 2019 | $562 | $79,849 | $4,485 | $75,364 |
| 2018 | $726 | $91,693 | $4,485 | $87,208 |
| 2017 | $730 | $91,883 | $4,485 | $87,398 |
| 2016 | $1,213 | $89,114 | $4,830 | $84,284 |
| 2015 | $1,251 | $89,597 | $4,830 | $84,767 |
| 2014 | -- | $88,715 | $4,830 | $83,885 |
Source: Public Records
Map
Nearby Homes
- 0 Bumpnose Rd Unit 730126
- 3098 Old Campbellton Rd
- 4114 Lafayette St
- 4146 Lafayette St
- 0 Carters Mill Rd Unit 730122
- 00 Carters Mill Rd
- 0 Carters Mill Rd Unit 767174
- 0 Carters Mill Rd Unit 776402
- 4124 Park Place Rd
- 4200 Kelson Ave
- 4071 Lafayette St
- 4181 Lafayette St
- 0 Kelson Ave
- 3003 Carters Mill Rd
- 4190 Green Meadows Trail Unit Lot 13
- 4186 Green Meadows Trail Unit Lot 12
- 4291 6th Ave
- 4169 Green Meadows Trail
- 4274 2nd Ave
- 4184 Green Meadows Trail Unit Lot 11
- 3096 Bumpnose Rd
- 3073 Bumpnose Rd
- 3098 Bumpnose Rd
- 3079 Gilmore St
- 3083 Gilmore St
- 3087 Gilmore St
- 3089 Gilmore St
- 3109 Gilmore Rd
- 3111 Gilmore Rd
- 3113 Gilmore Rd
- 3115 Gilmore Rd
- 3117 Gilmore Rd
- 3119 Gilmore Rd
- 3123 Gilmore Rd
- 3088 Gilmore St
- 3104 Gilmore Rd
- 3118 Gilmore Rd
- 3115 Wonder Rd
- 3136 Bumpnose Rd
- 4176 Green Meadows Trail Unit Lot 8