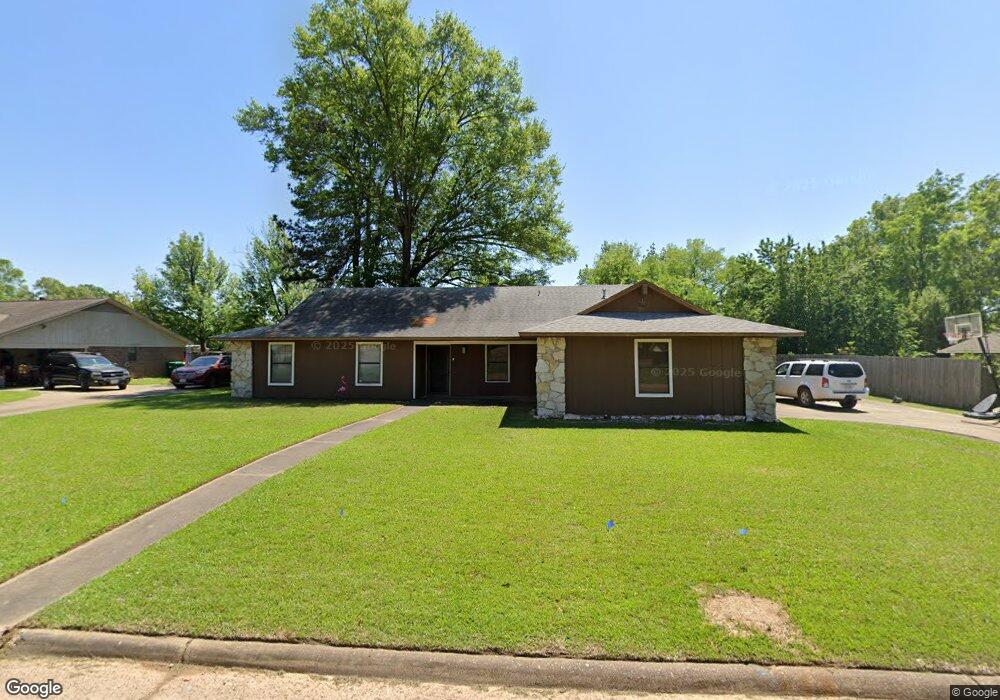
3105 Polly Cir Texarkana, TX 75503
Estimated Value: $220,152 - $295,000
3
Beds
2
Baths
1,990
Sq Ft
$132/Sq Ft
Est. Value
About This Home
This home is located at 3105 Polly Cir, Texarkana, TX 75503 and is currently estimated at $262,538, approximately $131 per square foot. 3105 Polly Cir is a home located in Bowie County with nearby schools including Margaret Fischer Davis Elementary School, Pleasant Grove Intermediate School, and Pleasant Grove Middle School.
Ownership History
Date
Name
Owned For
Owner Type
Purchase Details
Closed on
Jul 31, 2018
Sold by
Foster Michelle Lee Ann and Foster Brent A
Bought by
Perry Jason C
Current Estimated Value
Home Financials for this Owner
Home Financials are based on the most recent Mortgage that was taken out on this home.
Original Mortgage
$130,000
Outstanding Balance
$78,660
Interest Rate
4.5%
Mortgage Type
Purchase Money Mortgage
Estimated Equity
$183,878
Purchase Details
Closed on
Oct 19, 2017
Sold by
Foster Brent
Bought by
Ann Foster Michelle Lee
Purchase Details
Closed on
Dec 27, 2016
Sold by
Bogers James and Bogers Mary L
Bought by
Foster Brent A
Purchase Details
Closed on
Apr 25, 2008
Sold by
Sims Frieda Rebecca and Sims Rebecca
Bought by
Bogers James
Home Financials for this Owner
Home Financials are based on the most recent Mortgage that was taken out on this home.
Original Mortgage
$113,000
Interest Rate
5.86%
Mortgage Type
New Conventional
Create a Home Valuation Report for This Property
The Home Valuation Report is an in-depth analysis detailing your home's value as well as a comparison with similar homes in the area
Home Values in the Area
Average Home Value in this Area
Purchase History
| Date | Buyer | Sale Price | Title Company |
|---|---|---|---|
| Perry Jason C | -- | None Available | |
| Ann Foster Michelle Lee | -- | None Available | |
| Foster Brent A | -- | Twin City Title Company | |
| Bogers James | -- | None Available |
Source: Public Records
Mortgage History
| Date | Status | Borrower | Loan Amount |
|---|---|---|---|
| Open | Perry Jason C | $130,000 | |
| Previous Owner | Bogers James | $113,000 |
Source: Public Records
Tax History Compared to Growth
Tax History
| Year | Tax Paid | Tax Assessment Tax Assessment Total Assessment is a certain percentage of the fair market value that is determined by local assessors to be the total taxable value of land and additions on the property. | Land | Improvement |
|---|---|---|---|---|
| 2025 | $2,746 | $195,473 | -- | -- |
| 2024 | $2,746 | $177,703 | $25,000 | $186,033 |
| 2023 | $3,637 | $161,548 | $0 | $0 |
| 2022 | $3,606 | $180,154 | $25,000 | $155,154 |
| 2021 | $3,492 | $133,511 | $20,000 | $113,511 |
| 2020 | $3,337 | $126,939 | $20,000 | $106,939 |
| 2019 | $3,369 | $124,885 | $20,000 | $104,885 |
| 2018 | $3,284 | $122,421 | $20,000 | $102,421 |
| 2017 | $3,224 | $120,533 | $20,000 | $100,533 |
| 2016 | $3,224 | $120,533 | $20,000 | $100,533 |
| 2015 | $2,209 | $120,792 | $20,000 | $100,792 |
| 2014 | $2,209 | $117,113 | $20,000 | $97,113 |
Source: Public Records
Map
Nearby Homes
- 6107 Ben Burrough Rd
- 6106 Ben Burrough Rd
- 6210 Gould Place
- 3105 Bethany Ln
- 3004 Bethany Ln
- 3104 Bethany Ln
- 3108 Bethany Ln
- 5904 Cooks Ln
- 3007 Bethany Ln
- 3409 Williamsburg Ln
- 6301 Pecan Cove
- 3407 Williamsburg Ln
- 604 Clear Creek Dr
- 3501 Clear Creek Cir
- 6009 Beacon Hill Dr
- 6131 Summerhill Place
- 6137 Summerhill Place
- 8 Wild Oak Cir
- 5812 Cooks Ln
- 5810 Cooks Ln
- 3103 Polly Cir
- 3108 Keller Ave
- 3104 Polly Cir
- 3106 Polly Cir
- 3110 Keller Ave
- 3101 Polly Cir
- 6202 Polly Dr
- 6102 Polly Dr
- 3106 Keller Ave
- 3102 Polly Cir
- 6105 Polly Dr
- 6103 Polly Dr
- 0 Polly Dr
- 6107 Polly Dr
- 3114 Keller Ave
- 6204 Polly Dr
- 6105 Ben Burrough Rd
- 6103 Ben Burrough Rd
- 6206 Polly Dr
- 3113 Keller Ave