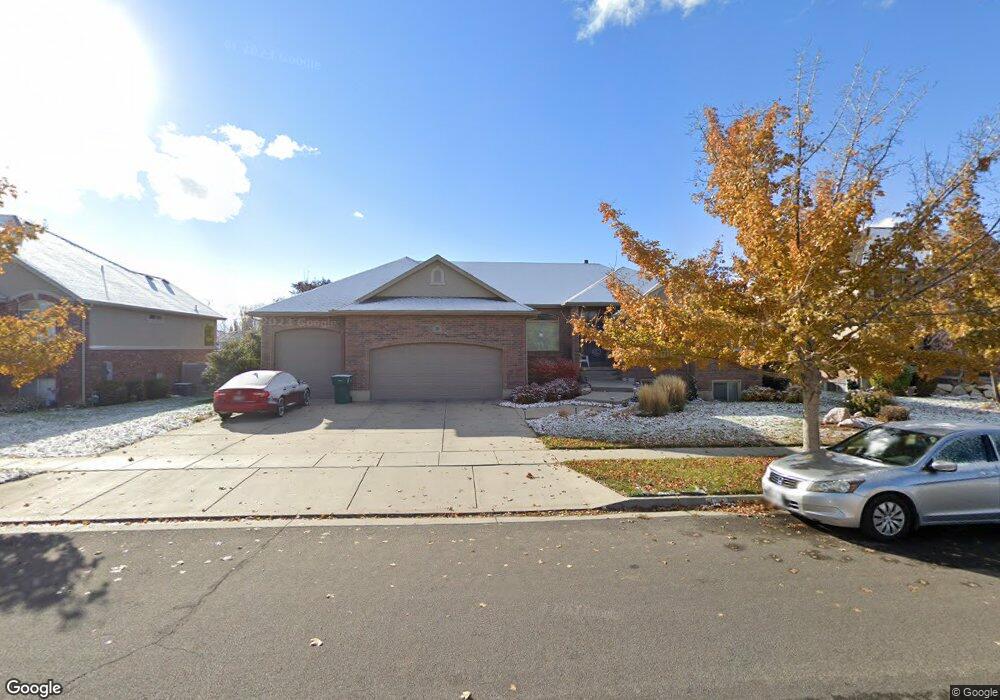
3105 W 350 N Layton, UT 84041
Estimated Value: $782,869 - $911,000
7
Beds
4
Baths
4,184
Sq Ft
$197/Sq Ft
Est. Value
About This Home
This home is located at 3105 W 350 N, Layton, UT 84041 and is currently estimated at $822,967, approximately $196 per square foot. 3105 W 350 N is a home located in Davis County with nearby schools including Sand Springs Elementary School, Legacy Junior High School, and Layton High School.
Ownership History
Date
Name
Owned For
Owner Type
Purchase Details
Closed on
Nov 9, 2018
Sold by
Stromberg Kyle R and Stromberg Jamie S
Bought by
Sprague Brady and Sprague Lisa
Current Estimated Value
Home Financials for this Owner
Home Financials are based on the most recent Mortgage that was taken out on this home.
Original Mortgage
$52,447
Outstanding Balance
$45,931
Interest Rate
4.7%
Mortgage Type
Credit Line Revolving
Estimated Equity
$777,036
Purchase Details
Closed on
Sep 9, 2003
Sold by
Mountain Green Development Llc
Bought by
Stromberg Kyle R and Stromberg Jamie S
Home Financials for this Owner
Home Financials are based on the most recent Mortgage that was taken out on this home.
Original Mortgage
$266,289
Interest Rate
6.06%
Mortgage Type
Purchase Money Mortgage
Create a Home Valuation Report for This Property
The Home Valuation Report is an in-depth analysis detailing your home's value as well as a comparison with similar homes in the area
Home Values in the Area
Average Home Value in this Area
Purchase History
| Date | Buyer | Sale Price | Title Company |
|---|---|---|---|
| Sprague Brady | -- | Stewart Title Ins Agency Of | |
| Stromberg Kyle R | -- | Bonneville Title Company Inc |
Source: Public Records
Mortgage History
| Date | Status | Borrower | Loan Amount |
|---|---|---|---|
| Open | Sprague Brady | $52,447 | |
| Previous Owner | Stromberg Kyle R | $266,289 | |
| Closed | Stromberg Kyle R | $10,000 |
Source: Public Records
Tax History
| Year | Tax Paid | Tax Assessment Tax Assessment Total Assessment is a certain percentage of the fair market value that is determined by local assessors to be the total taxable value of land and additions on the property. | Land | Improvement |
|---|---|---|---|---|
| 2025 | $3,883 | $407,550 | $145,082 | $262,468 |
| 2024 | $3,917 | $414,150 | $152,600 | $261,550 |
| 2023 | $3,820 | $712,000 | $167,202 | $544,798 |
| 2022 | $4,037 | $408,650 | $93,677 | $314,973 |
| 2021 | $3,723 | $562,000 | $140,467 | $421,533 |
| 2020 | $3,404 | $493,000 | $121,021 | $371,979 |
| 2019 | $3,307 | $469,000 | $117,179 | $351,821 |
| 2018 | $3,069 | $437,000 | $103,534 | $333,466 |
| 2016 | $2,873 | $211,035 | $44,303 | $166,732 |
| 2015 | $2,913 | $203,170 | $44,303 | $158,867 |
| 2014 | $2,478 | $176,698 | $44,303 | $132,395 |
| 2013 | -- | $182,092 | $42,721 | $139,371 |
Source: Public Records
Map
Nearby Homes
- 273 N 2975 W
- 84 N 3225 W
- 2794 W Gentile St
- 34 S 3600 W
- 245 S Summer Breeze Ln
- 818 N 2625 W
- 3535 W Overlook Dr
- 2480 S Main St
- 263 S Sunburst Dr
- 306 S Sunburst Dr
- 1250 N 2925 W
- 195 E 2325 S
- 2397 W Harmony Dr
- 841 N 2175 W
- 2500 N North Fort Ln Unit 188
- 2350 N 720 W
- 867 N 2125 W
- 1141 N 2275 W
- 921 W 2700 S
- 1974 W 775 N
Your Personal Tour Guide
Ask me questions while you tour the home.