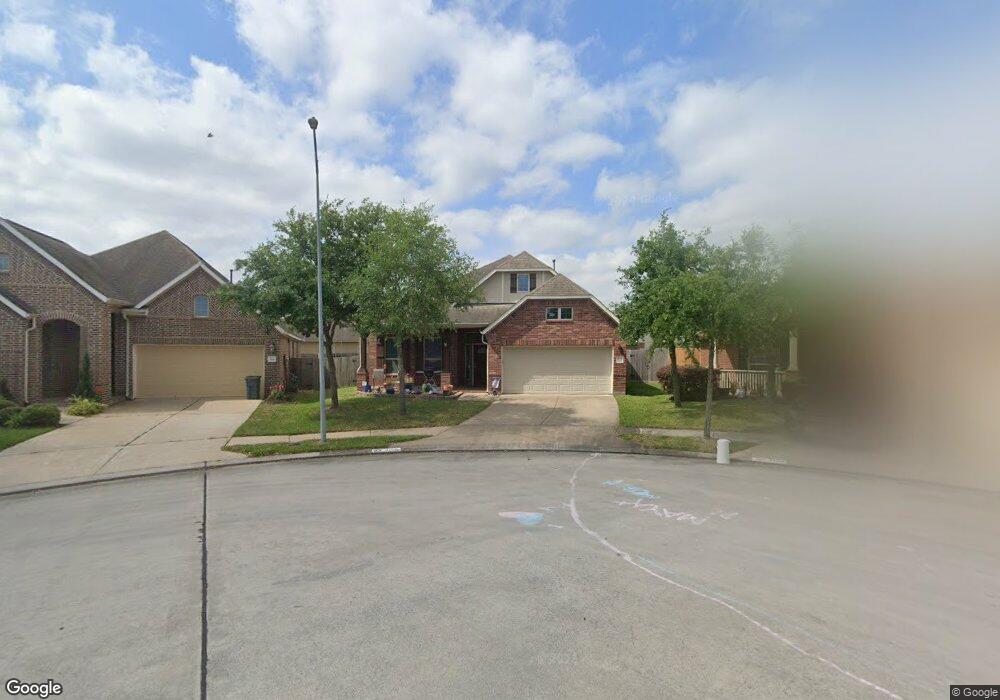
3106 Imperial Walk Ct Spring, TX 77386
Imperial Oaks NeighborhoodEstimated Value: $330,000 - $379,000
4
Beds
2
Baths
2,487
Sq Ft
$143/Sq Ft
Est. Value
About This Home
This home is located at 3106 Imperial Walk Ct, Spring, TX 77386 and is currently estimated at $356,839, approximately $143 per square foot. 3106 Imperial Walk Ct is a home located in Montgomery County with nearby schools including Kaufman Elementary School, Vogel Intermediate School, and Irons J High School.
Ownership History
Date
Name
Owned For
Owner Type
Purchase Details
Closed on
Jul 20, 2018
Sold by
Brahmandam Vishnu Sesha and Ngo Khanh
Bought by
Kv Ark Properties Llc
Current Estimated Value
Purchase Details
Closed on
May 11, 2011
Sold by
Relocation Advantage Llc
Bought by
Cone Jason P and Cone Sandra K
Home Financials for this Owner
Home Financials are based on the most recent Mortgage that was taken out on this home.
Original Mortgage
$192,297
Interest Rate
4.91%
Mortgage Type
FHA
Purchase Details
Closed on
Mar 24, 2010
Sold by
Mhi Partnership Ltd
Bought by
Svatek Keith T and Svatek Pamela
Home Financials for this Owner
Home Financials are based on the most recent Mortgage that was taken out on this home.
Original Mortgage
$158,793
Interest Rate
4.93%
Mortgage Type
New Conventional
Create a Home Valuation Report for This Property
The Home Valuation Report is an in-depth analysis detailing your home's value as well as a comparison with similar homes in the area
Home Values in the Area
Average Home Value in this Area
Purchase History
| Date | Buyer | Sale Price | Title Company |
|---|---|---|---|
| Kv Ark Properties Llc | -- | None Available | |
| Cone Jason P | -- | First American Title | |
| Relocation Advantage Llc | -- | First American Title | |
| Svatek Keith T | -- | Millennium Title Houston |
Source: Public Records
Mortgage History
| Date | Status | Borrower | Loan Amount |
|---|---|---|---|
| Previous Owner | Cone Jason P | $192,297 | |
| Previous Owner | Svatek Keith T | $158,793 |
Source: Public Records
Tax History Compared to Growth
Tax History
| Year | Tax Paid | Tax Assessment Tax Assessment Total Assessment is a certain percentage of the fair market value that is determined by local assessors to be the total taxable value of land and additions on the property. | Land | Improvement |
|---|---|---|---|---|
| 2025 | $6,838 | $371,290 | $50,000 | $321,290 |
| 2024 | $6,838 | $365,046 | -- | -- |
| 2023 | $6,280 | $331,860 | $50,000 | $311,310 |
| 2022 | $7,708 | $301,690 | $30,900 | $325,760 |
| 2021 | $7,577 | $274,260 | $30,900 | $243,360 |
| 2020 | $7,798 | $270,360 | $30,900 | $239,460 |
| 2019 | $7,563 | $255,130 | $30,900 | $224,230 |
| 2018 | $7,080 | $238,850 | $30,900 | $207,950 |
| 2017 | $7,122 | $238,850 | $30,900 | $207,950 |
| 2016 | $6,785 | $227,550 | $30,900 | $196,650 |
| 2015 | $6,465 | $227,550 | $30,900 | $196,650 |
| 2014 | $6,465 | $211,840 | $30,900 | $180,940 |
Source: Public Records
Map
Nearby Homes
- 31011 Imperial Walk Ln
- 3002 Rusty Bridge Ct
- 30915 Still Oaks Ln
- 3320 Atwood Creek Ct
- 2954 Smokey Forest Ln
- 30706 Legends Ridge Dr
- 31778 Twin Timbers Ln
- 30806 Academy Trace Dr
- 30723 Wisteria Trace Dr
- 32364 Mossy Pine Way
- 30723 Academy Trace Dr
- 3604 Magnolia Crest Ln
- 31527 Reston Cliff Ct
- 30742 Gardenia Trace Dr
- 31525 Ember Trail Ln
- 31563 Ember Trail Ln
- 2618 Bridgestone Park Ln
- 30802 Lavender Trace Dr
- 30627 Hackinson Dr
- 3317 Starlight Hill Ct
- 3102 Imperial Walk Ct
- 30923 Imperial Walk Ln
- 3110 Imperial Walk Ct
- 3022 Marlan Woods Ct
- 3019 Marlan Woods Ct
- 30919 Imperial Walk Ln
- 3103 Imperial Walk Ct
- 30911 Imperial Walk Ln
- 3018 Marlan Woods Ct
- 3015 Marlan Woods Ct
- 3107 Imperial Walk Ct
- 3111 Imperial Walk Ct
- 3018 Rusty Bridge Ct
- 30930 Imperial Walk Ln
- 30934 Imperial Walk Ln
- 3022 Rusty Bridge Ct
- 30926 Imperial Walk Ln
- 30903 Imperial Walk Ln
- 30938 Imperial Walk Ln
- 30922 Imperial Walk Ln