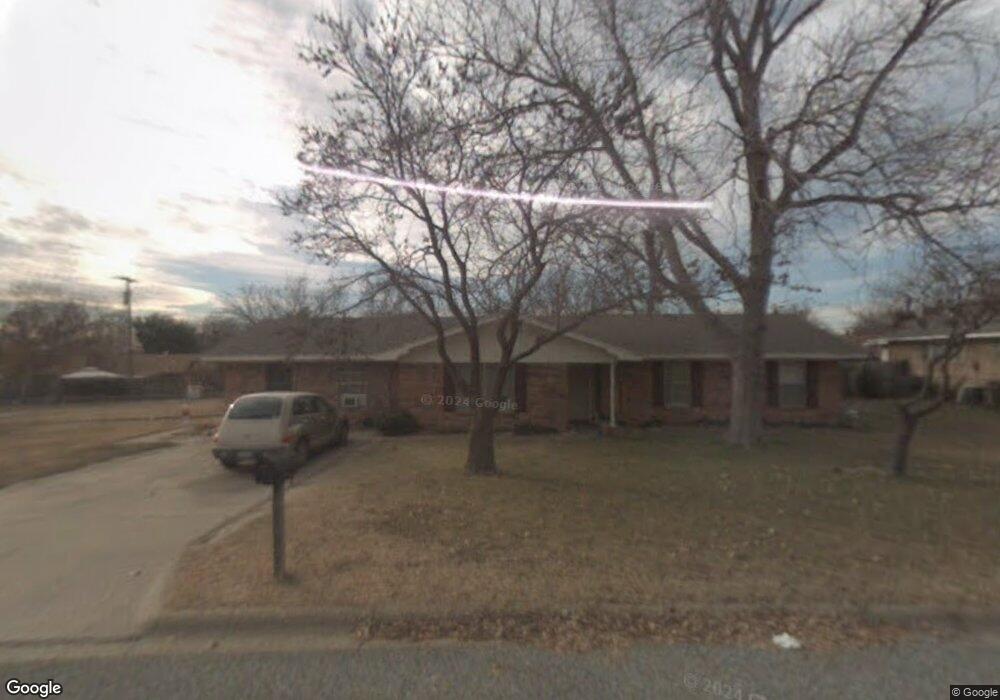
3106 Northpoint Rd Sherman, TX 75090
Estimated Value: $220,000 - $224,085
3
Beds
2
Baths
1,861
Sq Ft
$119/Sq Ft
Est. Value
About This Home
This home is located at 3106 Northpoint Rd, Sherman, TX 75090 and is currently estimated at $222,043, approximately $119 per square foot. 3106 Northpoint Rd is a home located in Grayson County with nearby schools including Percy W. Neblett Elementary School, Dillingham Intermediate School, and Piner Middle School.
Ownership History
Date
Name
Owned For
Owner Type
Purchase Details
Closed on
Jul 28, 2010
Sold by
The Secretary Of Housing & Urban Develop
Bought by
Berry Donald
Current Estimated Value
Purchase Details
Closed on
Mar 15, 2010
Sold by
Wells Fargo Bank Na
Bought by
The Secretary Of Housing & Urban Develop
Purchase Details
Closed on
Mar 2, 2010
Sold by
Wade Matthew and Wade Monica
Bought by
Wells Fargo Bank Na
Purchase Details
Closed on
Dec 7, 2005
Sold by
Robinson David W and Robison Rachael
Bought by
Wade Matthew and Wade Monica
Home Financials for this Owner
Home Financials are based on the most recent Mortgage that was taken out on this home.
Original Mortgage
$92,766
Interest Rate
6.12%
Mortgage Type
FHA
Create a Home Valuation Report for This Property
The Home Valuation Report is an in-depth analysis detailing your home's value as well as a comparison with similar homes in the area
Home Values in the Area
Average Home Value in this Area
Purchase History
| Date | Buyer | Sale Price | Title Company |
|---|---|---|---|
| Berry Donald | -- | Red River Title Co | |
| The Secretary Of Housing & Urban Develop | -- | None Available | |
| Wells Fargo Bank Na | $97,806 | None Available | |
| Wade Matthew | -- | -- |
Source: Public Records
Mortgage History
| Date | Status | Borrower | Loan Amount |
|---|---|---|---|
| Previous Owner | Wade Matthew | $92,766 |
Source: Public Records
Tax History Compared to Growth
Tax History
| Year | Tax Paid | Tax Assessment Tax Assessment Total Assessment is a certain percentage of the fair market value that is determined by local assessors to be the total taxable value of land and additions on the property. | Land | Improvement |
|---|---|---|---|---|
| 2025 | $4,457 | $198,800 | $66,415 | $132,385 |
| 2024 | $4,457 | $203,198 | $65,483 | $137,715 |
| 2023 | $4,257 | $193,872 | $51,850 | $142,022 |
| 2022 | $3,802 | $162,214 | $30,877 | $131,337 |
| 2021 | $3,435 | $137,037 | $30,877 | $106,160 |
| 2020 | $2,818 | $107,381 | $30,877 | $76,504 |
| 2019 | $2,419 | $89,761 | $10,137 | $79,624 |
| 2018 | $2,092 | $83,399 | $10,137 | $73,262 |
| 2017 | $1,973 | $79,268 | $10,137 | $69,131 |
| 2016 | $1,969 | $79,091 | $10,137 | $68,954 |
| 2015 | $1,921 | $77,327 | $10,137 | $67,190 |
| 2014 | $1,870 | $75,266 | $10,137 | $65,129 |
Source: Public Records
Map
Nearby Homes
- 1705 La Salle Dr
- TBD N Calais St
- 805 La Salle Dr
- 25 Luther Ln
- 815 E Pecan Grove Rd
- 914 Boone Dr
- 3707 Sumner Ct
- 2606 Bennett Ave
- 2.18 Acres E Sara Swamy Dr
- 95 Meadowlake
- 1719 Moreland Dr
- 705 E Lamberth Rd
- 15.125 acres E Peyton St
- 1516 E Peyton St
- TBD E Canyon Grove Rd
- 2012 Texoma Pkwy
- 1705 E Hilton St
- 000 N Masters St
- 2700 E Us-82
- 3706 Heatherwood Ln
- 3110 Northpoint Rd
- 3102 Northpoint Rd
- 3109 Northridge Dr
- 3113 Northridge Dr
- 3105 Northridge Dr
- 3117 Northridge Dr
- 3114 Northpoint Rd
- 3101 Northridge Dr
- 1401 La Salle Dr
- 1402 E Marseille St
- 1402 E Marseille Ln
- 3201 Northridge Dr
- 3202 Northpoint Rd
- 1405 La Salle Dr
- 1402 La Salle Dr
- 1406 E Marseille St
- 1306 La Salle Dr
- 3205 Northridge Dr
- 3110 Northridge Dr
- 3106 Northridge Dr