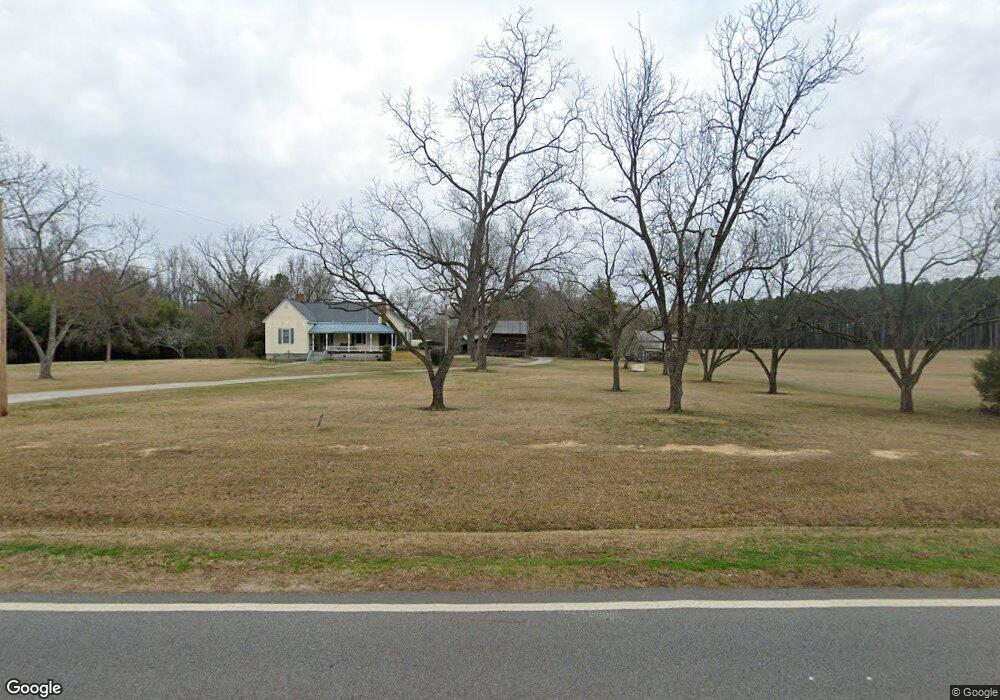
3107 Dozier Rd Appling, GA 30802
Estimated Value: $332,000 - $542,000
3
Beds
2
Baths
2,630
Sq Ft
$174/Sq Ft
Est. Value
About This Home
This home is located at 3107 Dozier Rd, Appling, GA 30802 and is currently estimated at $457,929, approximately $174 per square foot. 3107 Dozier Rd is a home located in Columbia County with nearby schools including North Columbia Elementary School, Harlem Middle School, and Suncoast Community High School.
Ownership History
Date
Name
Owned For
Owner Type
Purchase Details
Closed on
Aug 27, 2022
Sold by
Collins Karen D
Bought by
Collins Karen D and Hepner David W
Current Estimated Value
Home Financials for this Owner
Home Financials are based on the most recent Mortgage that was taken out on this home.
Original Mortgage
$160,000
Outstanding Balance
$135,367
Interest Rate
4.55%
Mortgage Type
New Conventional
Estimated Equity
$322,562
Purchase Details
Closed on
Jul 14, 2017
Sold by
Murdock Eric C
Bought by
Collins Karen D
Home Financials for this Owner
Home Financials are based on the most recent Mortgage that was taken out on this home.
Original Mortgage
$113,700
Interest Rate
3.96%
Mortgage Type
New Conventional
Purchase Details
Closed on
Jun 11, 2007
Sold by
Collins Eugene T
Bought by
Murdock Eric C
Home Financials for this Owner
Home Financials are based on the most recent Mortgage that was taken out on this home.
Original Mortgage
$128,000
Interest Rate
6.1%
Mortgage Type
New Conventional
Create a Home Valuation Report for This Property
The Home Valuation Report is an in-depth analysis detailing your home's value as well as a comparison with similar homes in the area
Home Values in the Area
Average Home Value in this Area
Purchase History
| Date | Buyer | Sale Price | Title Company |
|---|---|---|---|
| Collins Karen D | -- | -- | |
| Collins Karen D | -- | -- | |
| Murdock Eric C | $160,000 | -- |
Source: Public Records
Mortgage History
| Date | Status | Borrower | Loan Amount |
|---|---|---|---|
| Open | Collins Karen D | $160,000 | |
| Previous Owner | Collins Karen D | $113,700 | |
| Previous Owner | Murdock Eric C | $128,000 |
Source: Public Records
Tax History Compared to Growth
Tax History
| Year | Tax Paid | Tax Assessment Tax Assessment Total Assessment is a certain percentage of the fair market value that is determined by local assessors to be the total taxable value of land and additions on the property. | Land | Improvement |
|---|---|---|---|---|
| 2025 | $3,380 | $143,775 | $113,327 | $30,448 |
| 2024 | $2,883 | $117,408 | $91,907 | $25,501 |
| 2023 | $2,883 | $111,453 | $87,827 | $23,626 |
| 2022 | $2,444 | $96,058 | $73,547 | $22,511 |
| 2021 | $2,416 | $90,871 | $71,507 | $19,364 |
| 2020 | $1,991 | $73,710 | $54,147 | $19,563 |
| 2019 | $1,988 | $73,571 | $54,147 | $19,424 |
| 2018 | $2,300 | $84,526 | $66,147 | $18,379 |
| 2017 | $558 | $21,891 | $4,389 | $17,502 |
| 2016 | $462 | $19,119 | $3,285 | $15,834 |
| 2015 | $444 | $18,451 | $3,222 | $15,229 |
| 2014 | $432 | $17,808 | $3,158 | $14,650 |
Source: Public Records
Map
Nearby Homes
- 3079 Marshall Rd
- 3085 Marshall Rd
- 00 Marshall Rd
- 6384 Cobbham Rd
- 111 Beagle Chase Dr
- 119 Beagle Chase Dr
- 127 Beagle Chase Dr
- 143 Beagle Chase Dr
- 159 Beagle Chase Dr
- 175 Beagle Chase Dr
- 166 Beagle Chase Dr
- 142 Beagle Chase Dr
- 510 Dr
- 174 Beagle Chase Dr
- 135 Beagle Chase Dr
- 7054 Rance Perry Rd
- 128 Beagle Chase Dr
- 150 Beagle Chase Dr
- 158 Beagle Chase Dr
- 555 Rabbit Pen Dr
- 3098 Dozier Rd
- 3086 Dozier Rd
- 3118 Dozier Rd
- 3136 Dozier Rd
- 3166 Dozier Rd
- 1012 Arlington Way
- 1005 Arlington Way
- 1018 Arlington Way
- 1024 Arlington Way
- 1011 Arlington Way
- 1019 Arlington Way
- 3163 Dozier Rd
- 1030 Arlington Way
- 1025 Arlington Way
- 3171 Dozier Rd
- 1031 Arlington Way
- 1042 Arlington Way
- 3177 Dozier Rd
- 1037 Arlington Way
- 3180 Dozier Rd