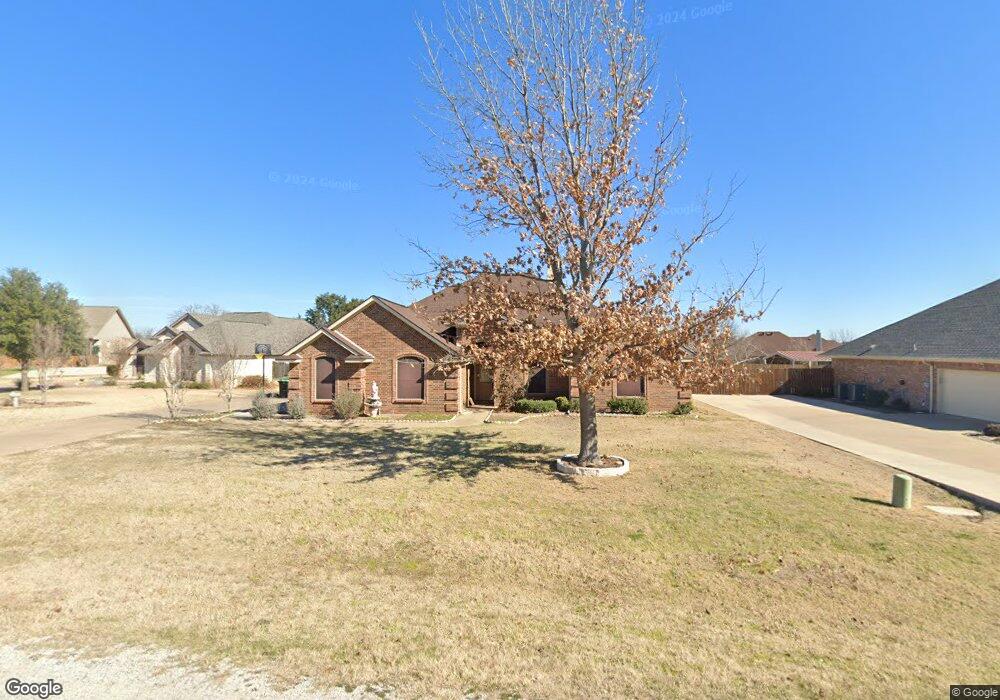
3107 Rim Rock Ct Granbury, TX 76049
Estimated Value: $386,354 - $436,000
3
Beds
2
Baths
1,988
Sq Ft
$211/Sq Ft
Est. Value
About This Home
This home is located at 3107 Rim Rock Ct, Granbury, TX 76049 and is currently estimated at $418,589, approximately $210 per square foot. 3107 Rim Rock Ct is a home located in Hood County with nearby schools including Acton Elementary School, Acton Middle School, and Granbury High School.
Ownership History
Date
Name
Owned For
Owner Type
Purchase Details
Closed on
Feb 8, 2010
Sold by
Marley Investments Lp
Bought by
Custom Classics Inc
Current Estimated Value
Purchase Details
Closed on
Jul 24, 2009
Sold by
Graham Lorie J
Bought by
Potts Ryan A and Potts Elisabeth J
Home Financials for this Owner
Home Financials are based on the most recent Mortgage that was taken out on this home.
Original Mortgage
$159,200
Interest Rate
5.71%
Mortgage Type
Purchase Money Mortgage
Purchase Details
Closed on
Mar 22, 2005
Sold by
Custom Classics Inc
Bought by
Graham Lori J
Home Financials for this Owner
Home Financials are based on the most recent Mortgage that was taken out on this home.
Original Mortgage
$148,400
Interest Rate
7%
Mortgage Type
Adjustable Rate Mortgage/ARM
Purchase Details
Closed on
May 25, 2004
Sold by
Marley Investments Llp
Bought by
Potts Ryan A
Purchase Details
Closed on
May 10, 2000
Sold by
Marley Investments L P
Bought by
Potts Ryan A
Create a Home Valuation Report for This Property
The Home Valuation Report is an in-depth analysis detailing your home's value as well as a comparison with similar homes in the area
Home Values in the Area
Average Home Value in this Area
Purchase History
| Date | Buyer | Sale Price | Title Company |
|---|---|---|---|
| Custom Classics Inc | -- | None Available | |
| Potts Ryan A | -- | None Available | |
| Graham Lori J | -- | First Land Title | |
| Potts Ryan A | -- | -- | |
| Potts Ryan A | -- | -- |
Source: Public Records
Mortgage History
| Date | Status | Borrower | Loan Amount |
|---|---|---|---|
| Previous Owner | Potts Ryan A | $159,200 | |
| Previous Owner | Graham Lori J | $148,400 |
Source: Public Records
Tax History Compared to Growth
Tax History
| Year | Tax Paid | Tax Assessment Tax Assessment Total Assessment is a certain percentage of the fair market value that is determined by local assessors to be the total taxable value of land and additions on the property. | Land | Improvement |
|---|---|---|---|---|
| 2025 | $3,783 | $408,837 | $45,000 | $384,180 |
| 2024 | $3,497 | $371,670 | $45,000 | $326,670 |
| 2023 | $3,630 | $375,430 | $45,000 | $330,430 |
| 2022 | $3,809 | $358,550 | $30,000 | $328,550 |
| 2021 | $4,415 | $287,580 | $30,000 | $257,580 |
| 2020 | $4,064 | $261,700 | $30,000 | $231,700 |
| 2019 | $4,075 | $250,660 | $30,000 | $220,660 |
| 2018 | $3,715 | $228,490 | $30,000 | $198,490 |
| 2017 | $3,731 | $223,100 | $30,000 | $193,100 |
| 2016 | $3,569 | $213,450 | $30,000 | $183,450 |
| 2015 | $3,374 | $215,210 | $30,000 | $185,210 |
| 2014 | $3,374 | $215,210 | $30,000 | $185,210 |
Source: Public Records
Map
Nearby Homes
- 4920 Centre Ct
- 2918 James Rd
- 3510 Fountain Way
- 3218 Fountain Way
- 2925 Willow Ridge Cir
- 2936 Willow Ridge Cir
- 1141 Avery Rd
- 1144 Avery Rd
- 1136 Avery Rd
- 4512 Cimmaron Trail
- 5003 Bueno Dr
- 5102 Largo Dr
- 2608 Royal Ln
- 4363 Acton Hwy
- 3207 Hummingbird Ct
- 5700 N Highland Dr
- 1301 James Rd
- 2180 James Rd
- 4410 Halo Ct
- 3108 Windcrest Ct
- 3105 Rim Rock Ct
- 3109 Rim Rock Ct
- 3104 Teocalli Ct
- 3111 Rim Rock Ct
- 3103 Rim Rock Ct
- 3108 Rim Rock Ct
- 3110 Rim Rock Ct
- 3106 Rim Rock Ct
- 3101 Rim Rock Ct
- 3102 Teocalli Ct
- 3112 Rim Rock Ct
- 3100 Rim Rock Ct
- 3104 Rim Rock Ct
- 3200 Leatherwood Ct
- 3107 Teocalli Ct
- 3100 Teocalli Ct
- 3102 Rim Rock Ct
- 3105 Teocalli Ct
- 4807 Stoney Creek Ct
- 3201 Leatherwood Ct