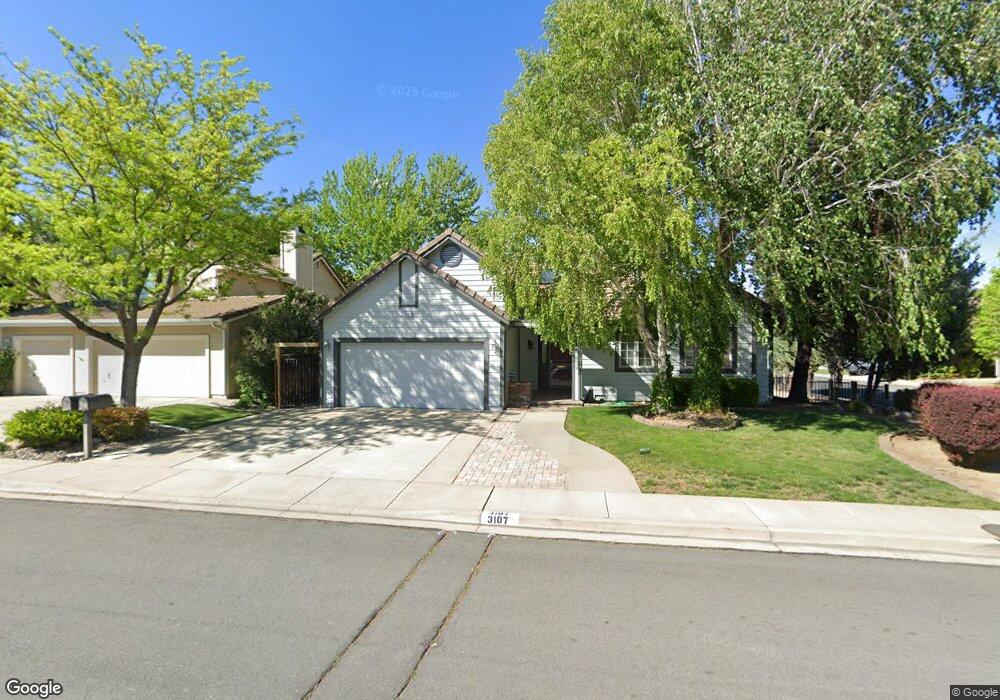
3107 Sweet Clover St Unit 2 Reno, NV 89509
Mayberry NeighborhoodEstimated Value: $651,539 - $702,000
3
Beds
2
Baths
1,721
Sq Ft
$392/Sq Ft
Est. Value
About This Home
This home is located at 3107 Sweet Clover St Unit 2, Reno, NV 89509 and is currently estimated at $674,385, approximately $391 per square foot. 3107 Sweet Clover St Unit 2 is a home located in Washoe County with nearby schools including Roy Gomm Elementary School, Darrell C Swope Middle School, and Reno High School.
Ownership History
Date
Name
Owned For
Owner Type
Purchase Details
Closed on
Sep 17, 2021
Sold by
Arnold Laura M
Bought by
Arnold Laura M
Current Estimated Value
Purchase Details
Closed on
Oct 21, 2020
Sold by
Varnum Nancy Lee
Bought by
Arnold Laura M and Arnold Kristy L
Purchase Details
Closed on
Jun 3, 2014
Sold by
Varnum Nancy Lee
Bought by
Arnold Kristy Lee
Purchase Details
Closed on
Apr 24, 2002
Sold by
Varnum Nancy Lee and Peevers Nancy L
Bought by
Varnum Nancy Lee
Home Financials for this Owner
Home Financials are based on the most recent Mortgage that was taken out on this home.
Original Mortgage
$198,400
Interest Rate
7.08%
Purchase Details
Closed on
Sep 4, 1996
Sold by
Osborn Anita Johanna and Huddleston Anita Johanna
Bought by
Osborn Anita Johanna
Create a Home Valuation Report for This Property
The Home Valuation Report is an in-depth analysis detailing your home's value as well as a comparison with similar homes in the area
Home Values in the Area
Average Home Value in this Area
Purchase History
| Date | Buyer | Sale Price | Title Company |
|---|---|---|---|
| Arnold Laura M | -- | None Listed On Document | |
| Arnold Laura M | -- | None Available | |
| Arnold Kristy Lee | -- | None Available | |
| Varnum Nancy Lee | $248,000 | Stewart Title Northern Nevad | |
| Osborn Anita Johanna | -- | -- |
Source: Public Records
Mortgage History
| Date | Status | Borrower | Loan Amount |
|---|---|---|---|
| Previous Owner | Varnum Nancy Lee | $198,400 |
Source: Public Records
Tax History Compared to Growth
Tax History
| Year | Tax Paid | Tax Assessment Tax Assessment Total Assessment is a certain percentage of the fair market value that is determined by local assessors to be the total taxable value of land and additions on the property. | Land | Improvement |
|---|---|---|---|---|
| 2025 | $3,719 | $115,598 | $53,620 | $61,978 |
| 2024 | $3,719 | $114,475 | $51,310 | $63,165 |
| 2023 | $3,445 | $111,809 | $51,660 | $60,149 |
| 2022 | $3,191 | $92,356 | $41,685 | $50,671 |
| 2021 | $2,955 | $83,088 | $32,305 | $50,783 |
| 2020 | $2,725 | $84,020 | $32,725 | $51,295 |
| 2019 | $2,646 | $80,115 | $29,890 | $50,225 |
| 2018 | $2,570 | $72,935 | $23,625 | $49,310 |
| 2017 | $2,496 | $71,638 | $21,840 | $49,798 |
| 2016 | $2,431 | $72,403 | $19,705 | $52,698 |
| 2015 | $2,429 | $70,438 | $17,500 | $52,938 |
| 2014 | $2,356 | $66,210 | $14,630 | $51,580 |
| 2013 | -- | $63,563 | $13,545 | $50,018 |
Source: Public Records
Map
Nearby Homes
- 3495 W Plumb Ln
- 1104 Ryegrass Ct
- 3274 Alum Creek Ct
- 3223 Alum Creek Ct
- 3945 San Donato Loop
- 3990 San Donato Loop
- 2085 La Fond Dr
- 2095 La Fond Dr
- 3164 Orrizonte Terrace
- 3323 Spring Creek Cir
- 1755 Benjamin Franklin Dr
- 3280 Thornhill Dr
- 4184 Del Curto Dr
- 4180 Del Curto Dr
- 2891 Sagittarius Dr
- 4090 Goodsell Ln
- 2024 Regent St
- 870 Lyman Ave
- 4060 Goodsell Ln
- 4000 Goodsell Ln
- 3111 Sweet Clover St
- 3108 Bramble Dr
- 3110 Bramble Dr
- 3113 Sweet Clover St
- 1542 Wildrye Dr Unit 2
- 1536 Wildrye Dr
- 3108 Sweet Clover St Unit 2
- 1548 Wildrye Dr
- 3112 Bramble Dr
- 3110 Sweet Clover St
- 1530 Wildrye Dr
- 3115 Sweet Clover St
- 1554 Wildrye Dr
- 1544 Wheatgrass Dr
- 3114 Bramble Dr
- 1560 Wildrye Dr
- 1548 Wheatgrass Dr
- 1539 Bramble Ct
- 3109 Bramble Dr
- 1545 Bramble Ct