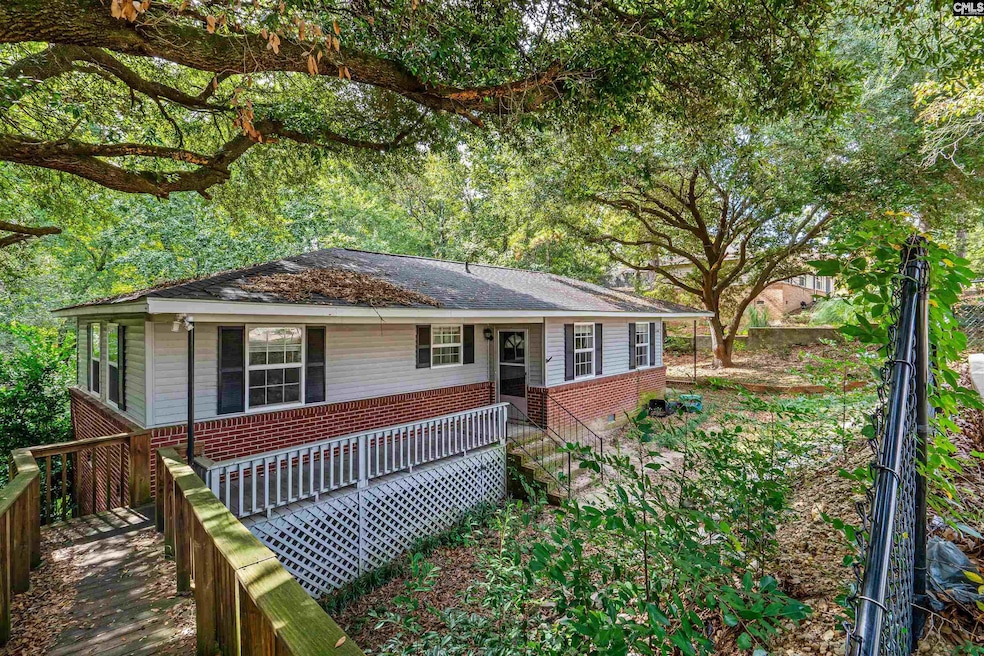
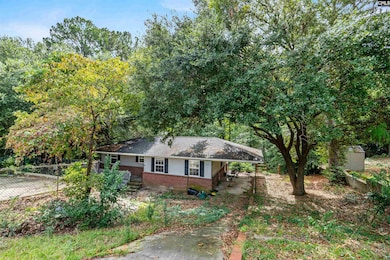
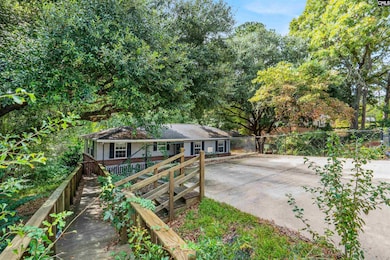
3107 Trailstream Rd West Columbia, SC 29170
Estimated payment $1,129/month
Highlights
- Main Floor Primary Bedroom
- Bungalow
- Central Air
- No HOA
- Attached Carport
About This Home
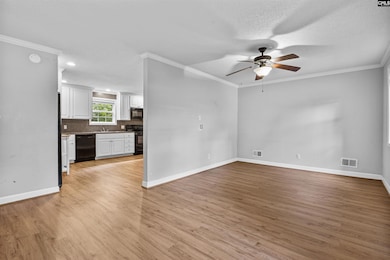
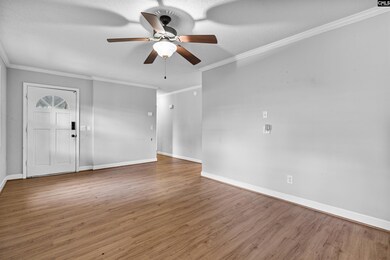
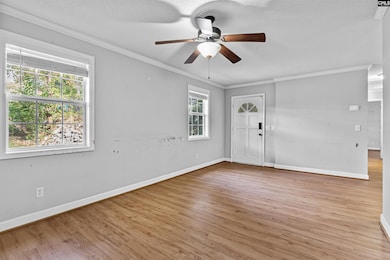
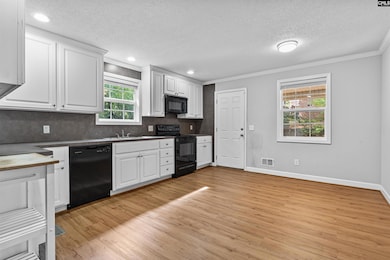
Being sold as-is, this charming 2-bedroom, 1-bath single-family home offers an excellent opportunity to own a move-in-ready property with value potential. The home features a covered carport/patio area, perfect for outdoor relaxation or additional parking. Inside, enjoy a spacious eat-in kitchen with updated appliances, including a glass-top electric range, microwave, refrigerator with ice maker, and dishwasher. A stacked washer and dryer are also included for convenience. The home is equipped with central gas heating and air conditioning, a gas water heater, and laminate flooring for easy maintenance. Outside, a storage shed provides extra space, and an active stream along the rear property line adds a peaceful, natural touch. Conveniently located near shopping, dining, and schools, this property blends comfort, value, and charm—an excellent opportunity for first-time buyers or investors alike! Disclaimer: CMLS has not reviewed and, therefore, does not endorse vendors who may appear in listings.
Home Details
Home Type
- Single Family
Est. Annual Taxes
- $3,435
Year Built
- Built in 1970
Lot Details
- 0.32 Acre Lot
Parking
- Attached Carport
Home Design
- Bungalow
- Vinyl Construction Material
Interior Spaces
- 982 Sq Ft Home
- Crawl Space
Bedrooms and Bathrooms
- 2 Bedrooms
- Primary Bedroom on Main
- 1 Full Bathroom
Schools
- Springdale Elementary School
- Fulmer Middle School
- Airport High School
Utilities
- Central Air
- Heating System Uses Gas
Community Details
- No Home Owners Association
- Westgate Subdivision
Map
Home Values in the Area
Average Home Value in this Area
Tax History
| Year | Tax Paid | Tax Assessment Tax Assessment Total Assessment is a certain percentage of the fair market value that is determined by local assessors to be the total taxable value of land and additions on the property. | Land | Improvement |
|---|---|---|---|---|
| 2024 | $3,435 | $8,700 | $1,800 | $6,900 |
| 2023 | $3,435 | $4,694 | $1,080 | $3,614 |
| 2022 | $1,673 | $4,694 | $1,080 | $3,614 |
| 2020 | $1,829 | $4,694 | $1,080 | $3,614 |
| 2019 | $1,604 | $4,483 | $1,080 | $3,403 |
| 2018 | $1,591 | $4,483 | $1,080 | $3,403 |
| 2017 | $1,561 | $4,483 | $1,080 | $3,403 |
| 2016 | $1,382 | $4,483 | $1,080 | $3,403 |
| 2014 | $1,287 | $4,922 | $1,080 | $3,842 |
| 2013 | -- | $4,920 | $1,080 | $3,840 |
Property History
| Date | Event | Price | List to Sale | Price per Sq Ft |
|---|---|---|---|---|
| 10/27/2025 10/27/25 | Price Changed | $159,999 | -2.4% | $163 / Sq Ft |
| 10/16/2025 10/16/25 | Price Changed | $164,000 | -3.0% | $167 / Sq Ft |
| 10/11/2025 10/11/25 | Price Changed | $169,000 | -5.6% | $172 / Sq Ft |
| 10/09/2025 10/09/25 | For Sale | $179,000 | -- | $182 / Sq Ft |
Purchase History
| Date | Type | Sale Price | Title Company |
|---|---|---|---|
| Deed | $145,000 | -- | |
| Limited Warranty Deed | $67,900 | None Available | |
| Legal Action Court Order | $2,500 | None Available | |
| Interfamily Deed Transfer | -- | -- | |
| Deed | $62,000 | -- | |
| Deed | $100,366 | -- |
Mortgage History
| Date | Status | Loan Amount | Loan Type |
|---|---|---|---|
| Open | $130,500 | New Conventional |
Source: Consolidated MLS (Columbia MLS)
MLS Number: 619222
APN: 005622-07-027
Disclaimer: Certain information contained herein is derived from information provided by parties other than Homes.com. All information provided is deemed reliable, but is not guaranteed to be accurate and should be independently verified.
![]() IDX information is provided exclusively for personal, non-commercial use, and may not be used for any purpose other than to identify prospective properties consumers may be interested in purchasing. Information is deemed reliable but not guaranteed.
IDX information is provided exclusively for personal, non-commercial use, and may not be used for any purpose other than to identify prospective properties consumers may be interested in purchasing. Information is deemed reliable but not guaranteed.
- 154 Stonewood Dr
- 104 Dryden Ct
- 3012 Glendale Rd
- 106 Stockman Dr
- 3002 Hilldale Rd
- 615 Dawn Dr
- 504 Dickson Hill Cir
- 318 John Wayne Dr
- 210 Parrish Pond Ct
- 3318 Hollydale Dr
- 333 Pinaster Path
- 329 Pinaster Path
- 391 Pinaster Path
- 349 Pinaster Path
- 341 Pinaster Path
- Magnolia Plan at Pinecrest
- Taylor II Plan at Pinecrest
- Easley Plan at Pinecrest
- Monroe II Plan at Pinecrest
- Cypress Plan at Pinecrest
- 3308 Oakdale Rd
- 533 Dawn Dr
- 387 Pinaster Path
- 200 Woodberry Rd
- 352 Gum Swamp Trail
- 2805 Shadblow Ln
- 2705 Leaphart Rd
- 258 Gum Swamp Trail
- 135 Silver Run Place
- 316 Autumn Mist Dr
- 10 Carroll Ct
- 135 Alexandria St Unit A
- 118 Goldleaf St
- 524 Wessinger St
- 1541 Beckham St
- 2309 Windsor Rd
- 1342 Karlaney Ave
- 50 Langley Dr
- 1321 Lafayette Ave
- 1235 Jensen St
