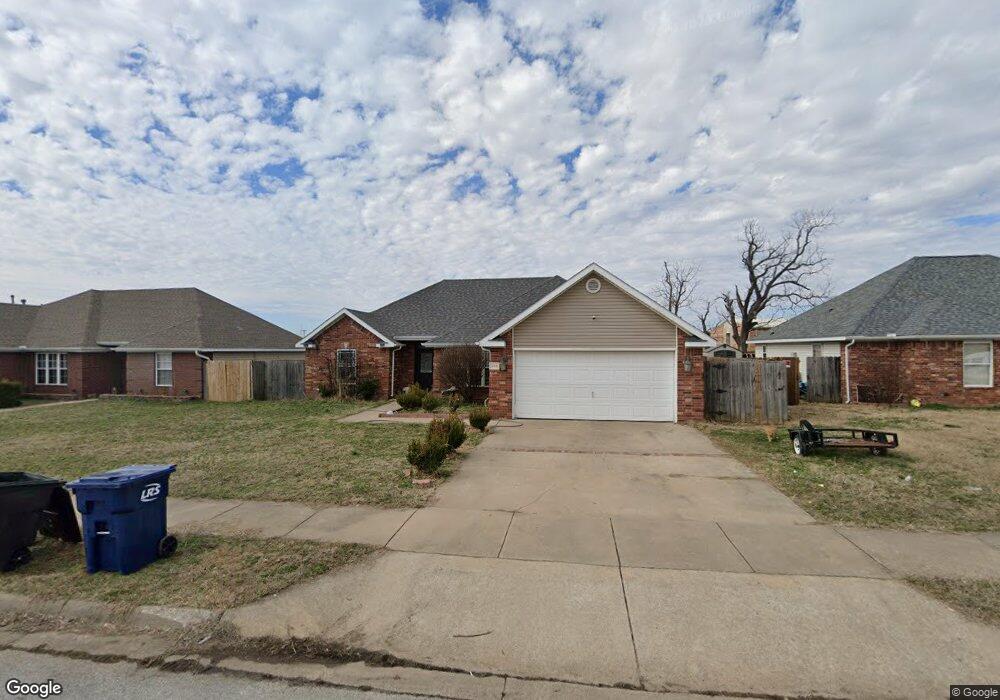
3108 G St Rogers, AR 72758
Estimated Value: $294,000 - $301,000
--
Bed
2
Baths
1,490
Sq Ft
$200/Sq Ft
Est. Value
About This Home
This home is located at 3108 G St, Rogers, AR 72758 and is currently estimated at $297,775, approximately $199 per square foot. 3108 G St is a home located in Benton County with nearby schools including Old Wire Elementary School, Kirksey Middle School, and Rogers High School.
Ownership History
Date
Name
Owned For
Owner Type
Purchase Details
Closed on
Jan 13, 2018
Sold by
Segura Francisco
Bought by
Santillan Serafin and Santillan Hortencia
Current Estimated Value
Purchase Details
Closed on
Nov 20, 2009
Sold by
Lpp Mortgage Ltd
Bought by
Segura Francisco
Home Financials for this Owner
Home Financials are based on the most recent Mortgage that was taken out on this home.
Original Mortgage
$96,224
Interest Rate
4.99%
Mortgage Type
FHA
Purchase Details
Closed on
Jul 15, 2009
Sold by
Haest Barry and Haest Mary Alice
Bought by
Lpp Mortgage Ltd
Purchase Details
Closed on
Dec 29, 2006
Sold by
River Valley Homes Inc
Bought by
Haest Barry and Haest Mary Alice
Home Financials for this Owner
Home Financials are based on the most recent Mortgage that was taken out on this home.
Original Mortgage
$133,650
Interest Rate
7.9%
Mortgage Type
Stand Alone First
Create a Home Valuation Report for This Property
The Home Valuation Report is an in-depth analysis detailing your home's value as well as a comparison with similar homes in the area
Home Values in the Area
Average Home Value in this Area
Purchase History
| Date | Buyer | Sale Price | Title Company |
|---|---|---|---|
| Santillan Serafin | $138,000 | Advantage Title & Escrow | |
| Segura Francisco | $98,000 | Lenders Title Company | |
| Lpp Mortgage Ltd | $115,000 | None Available | |
| Haest Barry | $148,500 | None Available |
Source: Public Records
Mortgage History
| Date | Status | Borrower | Loan Amount |
|---|---|---|---|
| Previous Owner | Segura Francisco | $96,224 | |
| Previous Owner | Haest Barry | $133,650 |
Source: Public Records
Tax History Compared to Growth
Tax History
| Year | Tax Paid | Tax Assessment Tax Assessment Total Assessment is a certain percentage of the fair market value that is determined by local assessors to be the total taxable value of land and additions on the property. | Land | Improvement |
|---|---|---|---|---|
| 2024 | $2,080 | $52,321 | $8,000 | $44,321 |
| 2023 | $1,891 | $35,740 | $6,000 | $29,740 |
| 2022 | $1,843 | $35,740 | $6,000 | $29,740 |
| 2021 | $1,685 | $35,740 | $6,000 | $29,740 |
| 2020 | $1,533 | $27,920 | $2,400 | $25,520 |
| 2019 | $1,533 | $27,920 | $2,400 | $25,520 |
| 2018 | $952 | $27,920 | $2,400 | $25,520 |
| 2017 | $777 | $27,920 | $2,400 | $25,520 |
| 2016 | $777 | $27,920 | $2,400 | $25,520 |
| 2015 | $1,057 | $19,990 | $3,800 | $16,190 |
| 2014 | $707 | $19,990 | $3,800 | $16,190 |
Source: Public Records
Map
Nearby Homes
- 805 E Asher Dr
- 3105 & 3107 S E St
- 905 E Asher Dr
- 409 E Marietta Ct
- 834 Mccann Rd
- 2911 S D St
- 304 Summerwood Ct
- 3108 & 3110 S B St
- 2717 Aspen Ln
- 407 E Mccann Rd
- 2711 Aspen Ln
- 12782 Stoney Point Rd
- 114 E Southpointe Ave
- 204 W Laurel Ave
- 3705 S 1st Place
- 205 W Broadway St
- 602 E Kara Ln
- 210 E Kara Ln
- 2018 S B Place
- 2002 S M St