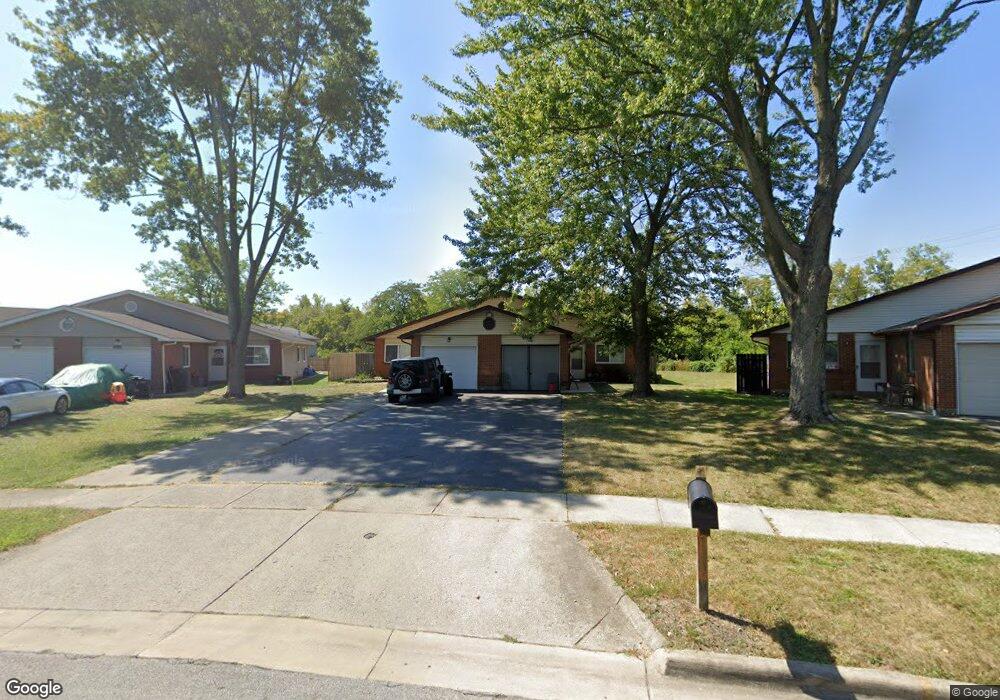
3109-3111 Charles Dr Grove City, OH 43123
Estimated Value: $307,339 - $348,000
5
Beds
2
Baths
1,872
Sq Ft
$175/Sq Ft
Est. Value
About This Home
This home is located at 3109-3111 Charles Dr, Grove City, OH 43123 and is currently estimated at $328,085, approximately $175 per square foot. 3109-3111 Charles Dr is a home located in Franklin County with nearby schools including Highland Park Elementary School, Park Street Intermediate School, and Grove City High School.
Ownership History
Date
Name
Owned For
Owner Type
Purchase Details
Closed on
Aug 2, 2021
Sold by
Bade Scott A and Bade Lynda M
Bought by
Patterson Matthew James
Current Estimated Value
Home Financials for this Owner
Home Financials are based on the most recent Mortgage that was taken out on this home.
Original Mortgage
$260,865
Outstanding Balance
$237,207
Interest Rate
2.9%
Mortgage Type
VA
Estimated Equity
$90,878
Purchase Details
Closed on
Nov 20, 1996
Sold by
Ruoff Thomas R
Bought by
Bade Scott A and Bade Lynda M
Home Financials for this Owner
Home Financials are based on the most recent Mortgage that was taken out on this home.
Original Mortgage
$79,900
Interest Rate
7.25%
Mortgage Type
New Conventional
Purchase Details
Closed on
Aug 4, 1988
Purchase Details
Closed on
Jan 1, 1986
Create a Home Valuation Report for This Property
The Home Valuation Report is an in-depth analysis detailing your home's value as well as a comparison with similar homes in the area
Home Values in the Area
Average Home Value in this Area
Purchase History
| Date | Buyer | Sale Price | Title Company |
|---|---|---|---|
| Patterson Matthew James | $255,000 | First American Title Ins Co | |
| Bade Scott A | $99,900 | -- | |
| -- | $91,900 | -- | |
| -- | $79,800 | -- |
Source: Public Records
Mortgage History
| Date | Status | Borrower | Loan Amount |
|---|---|---|---|
| Open | Patterson Matthew James | $260,865 | |
| Previous Owner | Bade Scott A | $79,900 |
Source: Public Records
Tax History Compared to Growth
Tax History
| Year | Tax Paid | Tax Assessment Tax Assessment Total Assessment is a certain percentage of the fair market value that is determined by local assessors to be the total taxable value of land and additions on the property. | Land | Improvement |
|---|---|---|---|---|
| 2024 | $3,725 | $80,960 | $23,030 | $57,930 |
| 2023 | $3,673 | $80,955 | $23,030 | $57,925 |
| 2022 | $3,180 | $51,530 | $11,870 | $39,660 |
| 2021 | $3,279 | $51,530 | $11,870 | $39,660 |
| 2020 | $3,270 | $51,530 | $11,870 | $39,660 |
| 2019 | $2,940 | $42,910 | $9,870 | $33,040 |
| 2018 | $3,075 | $42,910 | $9,870 | $33,040 |
| 2017 | $2,921 | $42,910 | $9,870 | $33,040 |
| 2016 | $3,218 | $43,230 | $9,870 | $33,360 |
| 2015 | $3,219 | $43,230 | $9,870 | $33,360 |
| 2014 | $3,222 | $43,230 | $9,870 | $33,360 |
| 2013 | $1,523 | $43,225 | $9,870 | $33,355 |
Source: Public Records
Map
Nearby Homes
- 2711-2713 Charles Dr
- 3120-3122 Walden Place
- 3267 Castleton St
- 3172 Pine Manor Blvd Unit 3172
- 2541 Swan Dr
- 2539 Swan Dr Unit 2539
- 2850 Parlin Dr
- 3156 Hoover Rd
- 3153 Scenic Way
- 3429 Devin Rd
- 3454 Independence St
- 3333 Tareyton Dr
- 3466 Central Ave
- 3474 Highland St
- 3187 Parkview Cir Unit 3187
- 3140 Catan Loop Unit 3140
- 2571 Scott Ct
- 2545 Scott Ct
- 3554 1st Ave
- 3378 Josephine Cir
- 3109 Charles Dr Unit 111
- 3109 Charles Dr Unit 3111
- 2757 Charles Dr Unit 759
- 2757-2759 Charles Dr Unit 759
- 2757-2759 Charles Dr
- 3103 Charles Dr Unit 105
- 2749 Charles Dr Unit 751
- 3093-3095 Charles Dr
- 3093 Charles Dr Unit 95
- 2740&2742 Charles Dr
- 3095 Charles Dr
- 2762 Walden Bluff Ct Unit 768
- 3098-3100 Charles Dr
- 3098-3100 Charles Dr Unit 100
- 3098 Charles Dr Unit 100
- 2741 Charles Dr Unit 743
- 2738 Walden Bluff Ct
- 3081 Charles Dr Unit 83
- 2734 Walden Bluff Ct
- 2740 Charles Dr Unit 742