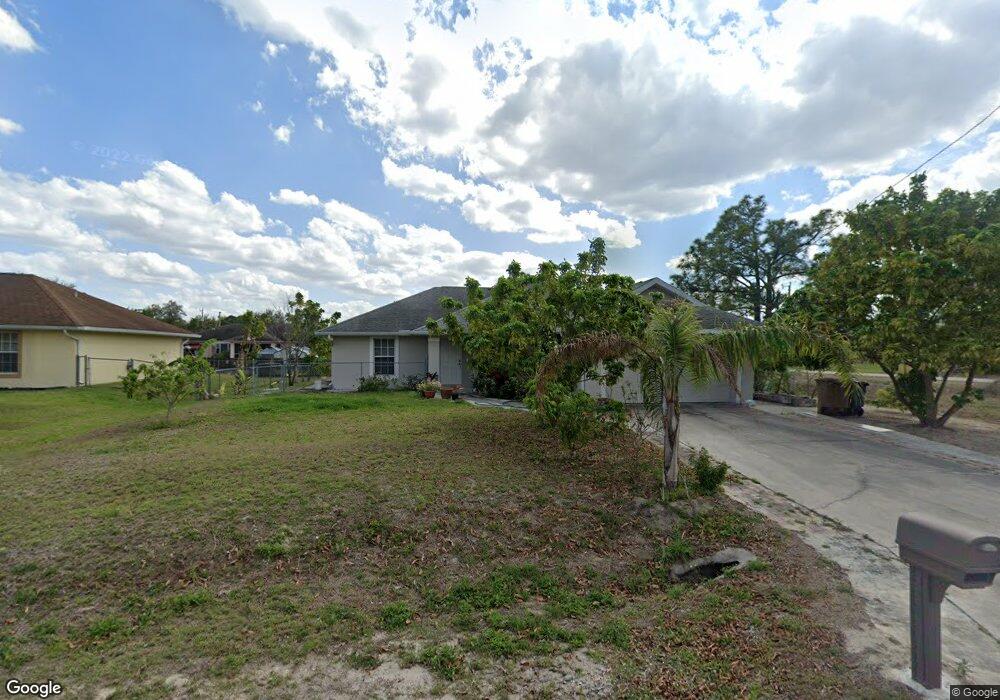
3109 9th St W Unit 9 Lehigh Acres, FL 33971
Richmond NeighborhoodEstimated Value: $262,986 - $328,000
3
Beds
2
Baths
1,625
Sq Ft
$177/Sq Ft
Est. Value
About This Home
This home is located at 3109 9th St W Unit 9, Lehigh Acres, FL 33971 and is currently estimated at $287,497, approximately $176 per square foot. 3109 9th St W Unit 9 is a home located in Lee County with nearby schools including Lehigh Elementary School, Gateway Elementary School, and Tice Elementary School.
Ownership History
Date
Name
Owned For
Owner Type
Purchase Details
Closed on
Apr 25, 2007
Sold by
Cypress Homes Inc
Bought by
Chan Chichoi and Liu Nanying
Current Estimated Value
Home Financials for this Owner
Home Financials are based on the most recent Mortgage that was taken out on this home.
Original Mortgage
$150,900
Outstanding Balance
$90,987
Interest Rate
6.1%
Mortgage Type
Unknown
Estimated Equity
$196,510
Purchase Details
Closed on
Apr 22, 2005
Sold by
Epstein Phyllis C
Bought by
Cypress Homes Inc
Create a Home Valuation Report for This Property
The Home Valuation Report is an in-depth analysis detailing your home's value as well as a comparison with similar homes in the area
Home Values in the Area
Average Home Value in this Area
Purchase History
| Date | Buyer | Sale Price | Title Company |
|---|---|---|---|
| Chan Chichoi | $206,300 | Executive Title Ins Svcs Inc | |
| Cypress Homes Inc | $25,000 | Executive Title Ins Svcs Inc | |
| Cypress Homes Inc | $25,000 | Executive Title Ins Svcs Inc |
Source: Public Records
Mortgage History
| Date | Status | Borrower | Loan Amount |
|---|---|---|---|
| Open | Chan Chichoi | $150,900 |
Source: Public Records
Tax History Compared to Growth
Tax History
| Year | Tax Paid | Tax Assessment Tax Assessment Total Assessment is a certain percentage of the fair market value that is determined by local assessors to be the total taxable value of land and additions on the property. | Land | Improvement |
|---|---|---|---|---|
| 2025 | $1,091 | $60,705 | -- | -- |
| 2024 | $1,091 | $58,994 | -- | -- |
| 2023 | $1,091 | $57,276 | $0 | $0 |
| 2022 | $1,000 | $55,608 | $0 | $0 |
| 2021 | $927 | $150,518 | $6,500 | $144,018 |
| 2020 | $925 | $53,243 | $0 | $0 |
| 2019 | $960 | $52,046 | $0 | $0 |
| 2018 | $934 | $51,076 | $0 | $0 |
| 2017 | $897 | $50,025 | $0 | $0 |
| 2016 | $862 | $103,254 | $4,400 | $98,854 |
| 2015 | $851 | $90,193 | $4,000 | $86,193 |
| 2014 | $685 | $78,899 | $2,715 | $76,184 |
| 2013 | -- | $63,905 | $2,400 | $61,505 |
Source: Public Records
Map
Nearby Homes