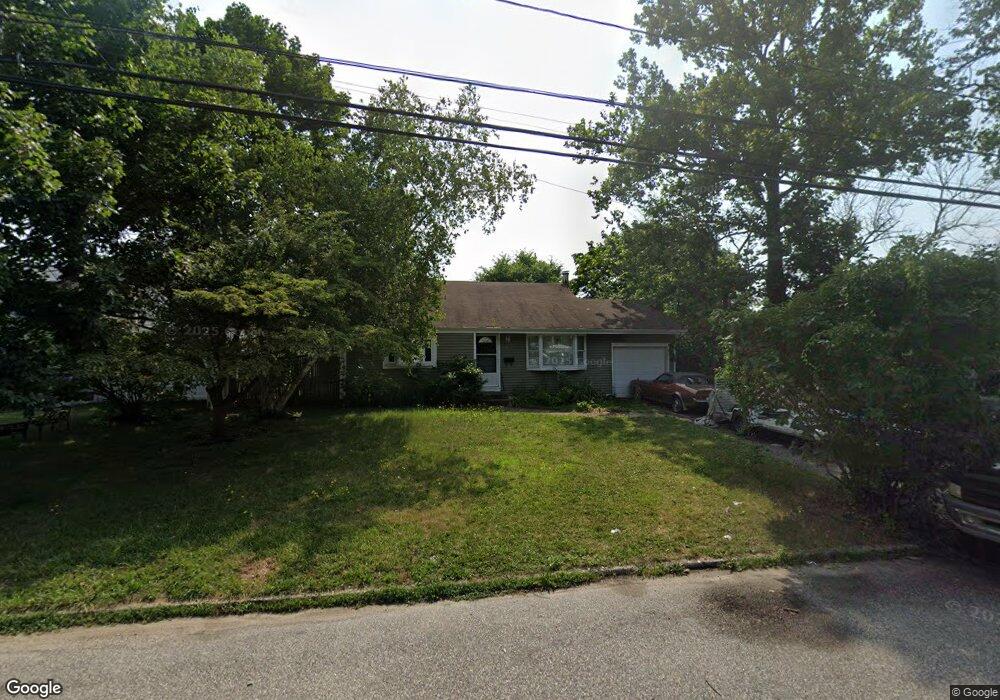
3109 Chestnut Ave Medford, NY 11763
Estimated Value: $475,000 - $558,000
3
Beds
1
Bath
1,483
Sq Ft
$357/Sq Ft
Est. Value
About This Home
This home is located at 3109 Chestnut Ave, Medford, NY 11763 and is currently estimated at $529,005, approximately $356 per square foot. 3109 Chestnut Ave is a home located in Suffolk County with nearby schools including Patchogue-Medford High School and Long Island Baptist Academy.
Ownership History
Date
Name
Owned For
Owner Type
Purchase Details
Closed on
Jan 27, 2005
Sold by
Zinkowski Charles R
Bought by
Madhaven Sethu
Current Estimated Value
Purchase Details
Closed on
Jul 19, 2002
Sold by
Rosie Allan Corp
Bought by
Zinkowski Charles R and Zinkowski Dawn L
Home Financials for this Owner
Home Financials are based on the most recent Mortgage that was taken out on this home.
Original Mortgage
$195,951
Interest Rate
6.58%
Mortgage Type
FHA
Purchase Details
Closed on
Jan 11, 2002
Sold by
Barry Allan R
Bought by
Rosie Allan Corp
Purchase Details
Closed on
Apr 27, 2000
Sold by
Barrett Sean
Bought by
Hud
Purchase Details
Closed on
Jun 15, 1998
Sold by
Pasemann John
Bought by
Barrett Sean
Home Financials for this Owner
Home Financials are based on the most recent Mortgage that was taken out on this home.
Original Mortgage
$97,444
Interest Rate
7.09%
Mortgage Type
FHA
Create a Home Valuation Report for This Property
The Home Valuation Report is an in-depth analysis detailing your home's value as well as a comparison with similar homes in the area
Home Values in the Area
Average Home Value in this Area
Purchase History
| Date | Buyer | Sale Price | Title Company |
|---|---|---|---|
| Madhaven Sethu | $290,000 | Ralph Fresolone | |
| Zinkowski Charles R | $197,500 | -- | |
| Rosie Allan Corp | -- | -- | |
| Barry Allan R | $140,000 | -- | |
| Hud | $121,593 | Stewart Title Insurance Co | |
| Barrett Sean | $97,500 | First American Title Ins Co |
Source: Public Records
Mortgage History
| Date | Status | Borrower | Loan Amount |
|---|---|---|---|
| Previous Owner | Zinkowski Charles R | $195,951 | |
| Previous Owner | Barrett Sean | $97,444 |
Source: Public Records
Tax History Compared to Growth
Tax History
| Year | Tax Paid | Tax Assessment Tax Assessment Total Assessment is a certain percentage of the fair market value that is determined by local assessors to be the total taxable value of land and additions on the property. | Land | Improvement |
|---|---|---|---|---|
| 2024 | $8,651 | $1,960 | $160 | $1,800 |
| 2023 | $8,651 | $1,960 | $160 | $1,800 |
| 2022 | $7,750 | $1,960 | $160 | $1,800 |
| 2021 | $7,750 | $1,960 | $160 | $1,800 |
| 2020 | $8,020 | $1,960 | $160 | $1,800 |
| 2019 | $8,020 | $0 | $0 | $0 |
| 2018 | $7,507 | $1,960 | $160 | $1,800 |
| 2017 | $7,507 | $1,960 | $160 | $1,800 |
| 2016 | $7,359 | $1,960 | $160 | $1,800 |
| 2015 | -- | $1,960 | $160 | $1,800 |
| 2014 | -- | $1,960 | $160 | $1,800 |
Source: Public Records
Map
Nearby Homes
- 3115 Chestnut Ave
- 1600 Fire Ave
- 3106 Devon Ave
- 3004 New London Ave
- 1401 Race Ave
- 1301 Race Ave
- 49 Country Rd
- 1902 Race Ave
- 1300 Race Ave
- 2905 Beechnut Ave
- 0 Cedar Ln Unit ONE3556748
- 3019 Sipp Ave
- 241 Middle Island Rd
- 2405 Fire Ave
- 2401 Race Ave
- 2816 Acorn Ave
- 2909 Falcon Ave
- 3110 Kane Ave
- 3115 Heather Ave
- 2812 Sipp Ave
- 3107 Chestnut Ave
- 3111 Chestnut Ave
- 3108 New London Ave
- 3110 New London Ave
- 3108 Chestnut Ave
- 3105 Chestnut Ave
- 3106 Chestnut Ave
- 3110 Chestnut Ave
- 3104 New London Ave
- 3112 New London Ave
- 3112 Chestnut Ave
- 3104 Chestnut Ave
- 3103 Chestnut Ave
- 3117 Chestnut Ave
- 3109 Newport Ave
- 3102 New London Ave
- 3114 New London Ave
- 3111 Newport Ave
- 3107 Newport Ave
- 3109 New London Ave