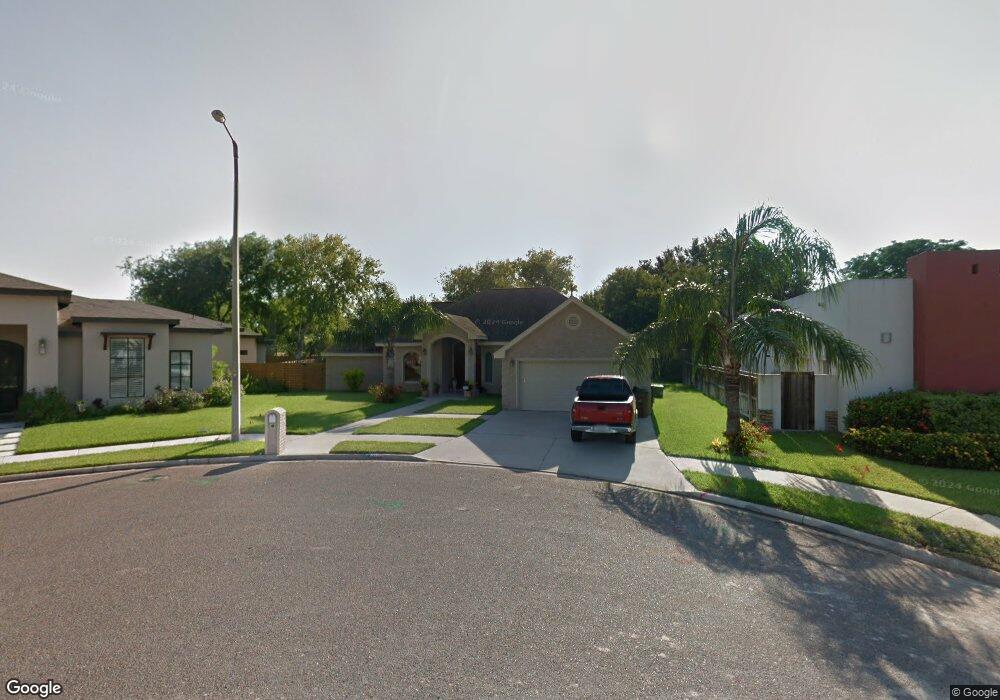
3109 Leslie St Edinburg, TX 78539
Estimated Value: $368,000 - $473,000
3
Beds
2
Baths
4,547
Sq Ft
$97/Sq Ft
Est. Value
About This Home
This home is located at 3109 Leslie St, Edinburg, TX 78539 and is currently estimated at $440,391, approximately $96 per square foot. 3109 Leslie St is a home located in Hidalgo County with nearby schools including Canterbury Elementary School, South Middle School, and Robert Vela High School.
Ownership History
Date
Name
Owned For
Owner Type
Purchase Details
Closed on
Jun 15, 2007
Sold by
Belez Construction Co Llc
Bought by
Casares Julio and Casares Maria Luz
Current Estimated Value
Home Financials for this Owner
Home Financials are based on the most recent Mortgage that was taken out on this home.
Original Mortgage
$196,200
Outstanding Balance
$158,374
Interest Rate
6.19%
Mortgage Type
Purchase Money Mortgage
Estimated Equity
$282,017
Purchase Details
Closed on
Jul 25, 2006
Sold by
Gary Burch Construction Inc
Bought by
Brez Construction Co Llc
Home Financials for this Owner
Home Financials are based on the most recent Mortgage that was taken out on this home.
Original Mortgage
$196,972
Interest Rate
6.78%
Mortgage Type
Purchase Money Mortgage
Create a Home Valuation Report for This Property
The Home Valuation Report is an in-depth analysis detailing your home's value as well as a comparison with similar homes in the area
Home Values in the Area
Average Home Value in this Area
Purchase History
| Date | Buyer | Sale Price | Title Company |
|---|---|---|---|
| Casares Julio | -- | Security Land Title Co | |
| Brez Construction Co Llc | -- | None Available |
Source: Public Records
Mortgage History
| Date | Status | Borrower | Loan Amount |
|---|---|---|---|
| Open | Casares Julio | $196,200 | |
| Previous Owner | Brez Construction Co Llc | $196,972 |
Source: Public Records
Tax History Compared to Growth
Tax History
| Year | Tax Paid | Tax Assessment Tax Assessment Total Assessment is a certain percentage of the fair market value that is determined by local assessors to be the total taxable value of land and additions on the property. | Land | Improvement |
|---|---|---|---|---|
| 2025 | $10,636 | $419,931 | $70,351 | $349,580 |
| 2024 | $10,636 | $442,939 | $70,351 | $372,588 |
| 2023 | $10,730 | $447,223 | $70,351 | $376,872 |
| 2022 | $10,647 | $408,876 | $70,351 | $338,525 |
| 2021 | $9,458 | $349,279 | $70,351 | $278,928 |
| 2020 | $8,257 | $303,465 | $70,351 | $233,114 |
| 2019 | $7,899 | $284,432 | $59,004 | $225,428 |
| 2018 | $7,326 | $263,148 | $51,062 | $212,086 |
| 2017 | $7,102 | $254,184 | $39,715 | $214,469 |
| 2016 | $7,169 | $256,568 | $39,715 | $216,853 |
| 2015 | $6,840 | $258,950 | $39,715 | $219,235 |
Source: Public Records
Map
Nearby Homes
- 2822 Maria Luiza Dr
- 1615 Gloria Ann Dr
- 2009 Rochester Ave
- 1707 Red River Ave
- 3305 Crystal Falls Ave
- 2728 Leslie St
- 3120 S Sugar Rd
- 3302 S Sugar Rd Unit H
- 3302 S Sugar Rd Unit B
- 1510 W Canton Rd
- 3204 S Wharton Ave
- 3200 S Wharton Ave
- 3216 S Wharton Ave
- 3408 Madison Ave
- 1604 W Saint Claire Ave
- 1505 Candy Ln
- 1920 Katherine Ave
- 000 W Rockefeller Ln
- 1425 Sweet Ln
- 2455 W Brown St
- 1812 Nautical Ln
- 3114 Garza St
- 3116 Garza St
- 3011 Leslie St
- 1810 Nautical Ln
- 3112 Garza St
- 3009 Leslie St
- 3100 Leslie St
- 3012 Leslie St
- 3007 Leslie St
- 3022 Garza St
- 3103 Ocean View Dr
- 1902 Mesa Dr
- 1821 Gloria Ann Dr
- 1821 Gloria Ann Dr Unit 20
- 3203 S Montevideo Ave
- 3023 Ocean View Dr
- 3010 Leslie St
- 3010 Leslie St Unit 20
- 3003 Leslie St