Estimated Value: $220,000 - $244,000
--
Bed
2
Baths
1,326
Sq Ft
$172/Sq Ft
Est. Value
About This Home
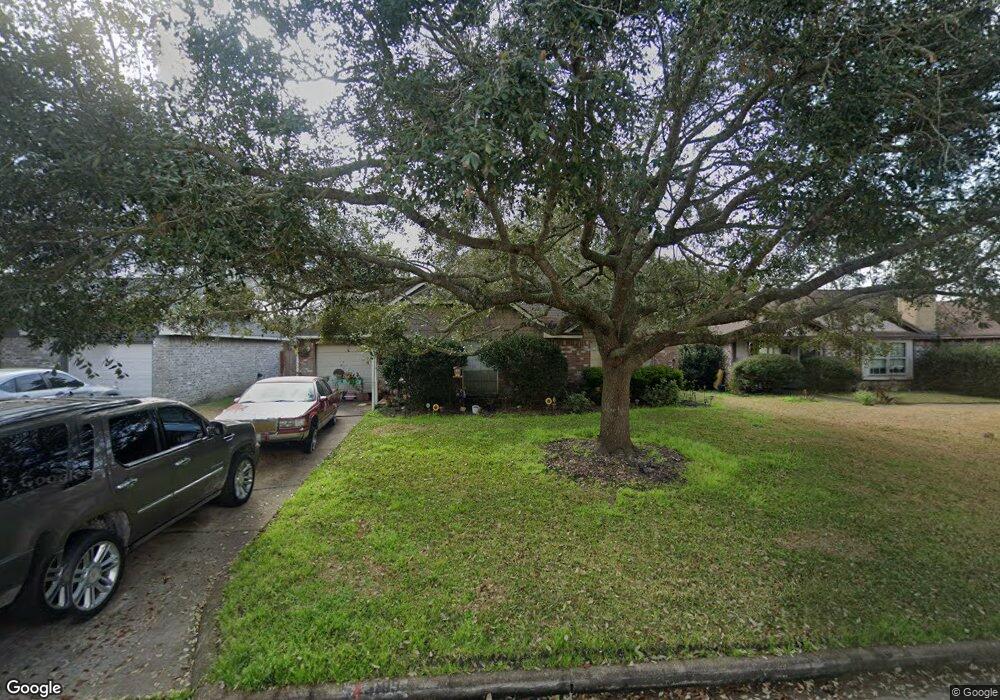
This home is located at 3109 Wood Fox Dr, Alvin, TX 77511 and is currently estimated at $228,355, approximately $172 per square foot. 3109 Wood Fox Dr is a home located in Brazoria County with nearby schools including Bob & Betty Nelson Elementary School, Alvin Junior High School, and Alvin High School.
Ownership History
Date
Name
Owned For
Owner Type
Purchase Details
Closed on
May 15, 2015
Sold by
Ouellette Matthew James and Ouellette Tamilyn
Bought by
Bamburg Nikki Jo
Current Estimated Value
Home Financials for this Owner
Home Financials are based on the most recent Mortgage that was taken out on this home.
Original Mortgage
$112,917
Outstanding Balance
$90,231
Interest Rate
4.75%
Mortgage Type
FHA
Estimated Equity
$138,124
Purchase Details
Closed on
Jan 5, 2001
Sold by
Foster Elisa Faith
Bought by
Ouellette Matthew James and Ouellette Tami Lyn
Home Financials for this Owner
Home Financials are based on the most recent Mortgage that was taken out on this home.
Original Mortgage
$78,380
Interest Rate
7.63%
Purchase Details
Closed on
Feb 18, 1994
Sold by
Mcmillan Morgan J and Mcmillan Joyce M
Bought by
Foster Donald and Foster Lisa
Create a Home Valuation Report for This Property
The Home Valuation Report is an in-depth analysis detailing your home's value as well as a comparison with similar homes in the area
Home Values in the Area
Average Home Value in this Area
Purchase History
| Date | Buyer | Sale Price | Title Company |
|---|---|---|---|
| Bamburg Nikki Jo | -- | Alamo Title Co | |
| Ouellette Matthew James | -- | American Title Co | |
| Foster Donald | -- | -- |
Source: Public Records
Mortgage History
| Date | Status | Borrower | Loan Amount |
|---|---|---|---|
| Open | Bamburg Nikki Jo | $112,917 | |
| Previous Owner | Ouellette Matthew James | $78,380 |
Source: Public Records
Tax History Compared to Growth
Tax History
| Year | Tax Paid | Tax Assessment Tax Assessment Total Assessment is a certain percentage of the fair market value that is determined by local assessors to be the total taxable value of land and additions on the property. | Land | Improvement |
|---|---|---|---|---|
| 2025 | $3,094 | $188,590 | $18,250 | $170,340 |
| 2024 | $3,094 | $190,680 | $18,250 | $172,430 |
| 2023 | $3,094 | $180,496 | $18,250 | $177,680 |
| 2022 | $4,501 | $164,087 | $18,250 | $156,260 |
| 2021 | $4,307 | $149,170 | $16,850 | $132,320 |
| 2020 | $3,995 | $149,170 | $16,850 | $132,320 |
| 2019 | $3,728 | $124,100 | $14,040 | $110,060 |
| 2018 | $3,525 | $124,100 | $14,040 | $110,060 |
| 2017 | $3,246 | $106,510 | $14,040 | $92,470 |
| 2016 | $3,135 | $102,890 | $14,040 | $88,850 |
| 2015 | $3,036 | $104,120 | $14,040 | $90,080 |
| 2014 | $3,036 | $97,670 | $14,040 | $83,630 |
Source: Public Records
Map
Nearby Homes
- 3206 Deer Trail Dr
- 2609 Quail Run Dr
- 2609 Adams St
- 1916 Tracy Lynn Ln
- 2604 Adams St
- 1902 Westview Dr
- 2714 Westfield St
- 2514 Westfield St
- 221 Magnolia Laurel Dr
- 239 Bay Laurel Ct
- 211 Orchard Laurel Dr
- 220 Magnolia Laurel Dr
- 204 Orchard Laurel Dr
- 243 Bay Laurel Ct
- 230 Magnolia Laurel Dr
- 00 Davis Bend County Rd 179 Rd
- 000 Corner of County Road 180 and County Road 181 Rd
- 2306 Westfield St
- 2408 Chelmsford Ct
- 2016 W Davis Bend St
- 3107 Wood Fox Dr
- 3201 Wood Fox Dr
- 3110 Deer Trail Dr
- 3203 Wood Fox Dr
- 3105 Wood Fox Dr
- 3202 Deer Trail Dr
- 3108 Deer Trail Dr
- 3204 Deer Trail Dr
- 3106 Deer Trail Dr
- 3103 Wood Fox Dr
- 3205 Wood Fox Dr
- 3110 Wood Fox Dr
- 3108 Wood Fox Dr
- 3202 Wood Fox Dr
- 3104 Deer Trail Dr
- 3204 Wood Fox Dr
- 3106 Wood Fox Dr
- 3101 Wood Fox Dr
- 3207 Wood Fox Dr
- 3104 Wood Fox Dr