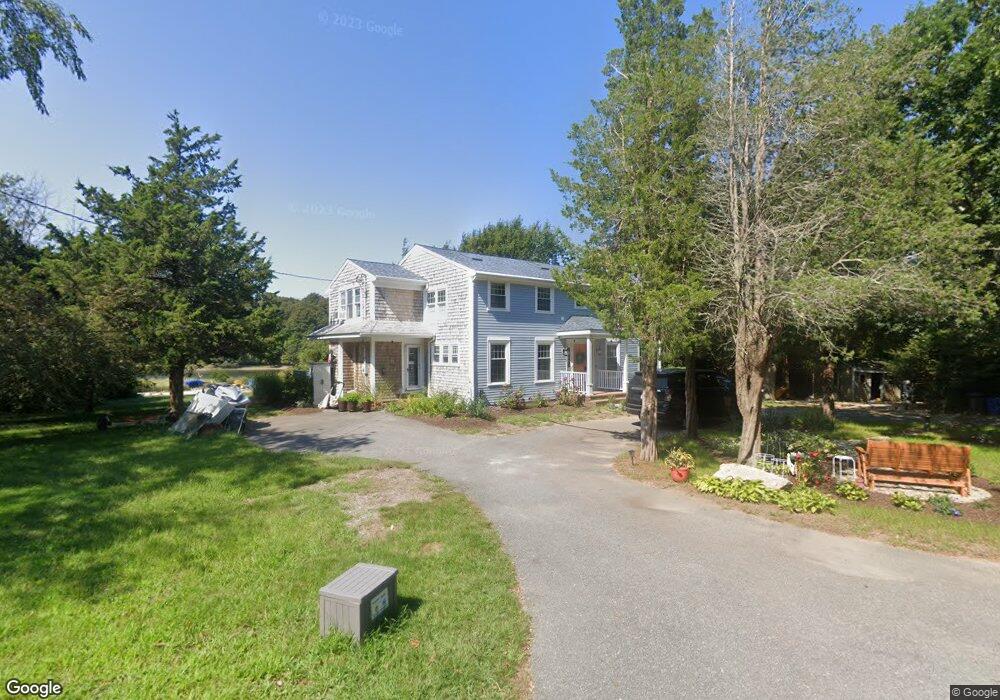
310A Shore Rd Bourne, MA 02532
Monument Beach NeighborhoodEstimated Value: $1,019,000 - $1,461,000
4
Beds
3
Baths
2,552
Sq Ft
$496/Sq Ft
Est. Value
About This Home
This home is located at 310A Shore Rd, Bourne, MA 02532 and is currently estimated at $1,266,036, approximately $496 per square foot. 310A Shore Rd is a home located in Barnstable County with nearby schools including Bourne High School, St Margaret Regional School, and Cadence Academy Preschool - Bourne.
Ownership History
Date
Name
Owned For
Owner Type
Purchase Details
Closed on
Nov 17, 2021
Sold by
Moffa Kara B
Bought by
Moffa Family Rt 2021 and Moffa
Current Estimated Value
Purchase Details
Closed on
Nov 11, 2021
Sold by
Moffa John S
Bought by
Moffa Kara B
Purchase Details
Closed on
Aug 22, 2017
Sold by
Regan Kelly
Bought by
Moffa John S
Home Financials for this Owner
Home Financials are based on the most recent Mortgage that was taken out on this home.
Original Mortgage
$487,000
Interest Rate
2.99%
Mortgage Type
Purchase Money Mortgage
Purchase Details
Closed on
Nov 26, 1996
Sold by
Mollica Ronald M and Mollica Vera M
Bought by
Regan Kelly
Purchase Details
Closed on
Aug 2, 1993
Sold by
Mollica Rose and Mollica John J
Bought by
Hough Kevin J and Mcneill Lori B
Create a Home Valuation Report for This Property
The Home Valuation Report is an in-depth analysis detailing your home's value as well as a comparison with similar homes in the area
Home Values in the Area
Average Home Value in this Area
Purchase History
| Date | Buyer | Sale Price | Title Company |
|---|---|---|---|
| Moffa Family Rt 2021 | -- | None Available | |
| Moffa Family Rt 2021 | -- | None Available | |
| Moffa Kara B | -- | None Available | |
| Moffa Kara B | -- | None Available | |
| Moffa John S | $790,000 | -- | |
| Moffa John S | $790,000 | -- | |
| Regan Kelly | $305,000 | -- | |
| Regan Kelly | $305,000 | -- | |
| Hough Kevin J | $112,000 | -- | |
| Hough Kevin J | $112,000 | -- |
Source: Public Records
Mortgage History
| Date | Status | Borrower | Loan Amount |
|---|---|---|---|
| Previous Owner | Moffa John S | $487,000 | |
| Previous Owner | Hough Kevin J | $250,000 | |
| Previous Owner | Hough Kevin J | $225,700 |
Source: Public Records
Tax History
| Year | Tax Paid | Tax Assessment Tax Assessment Total Assessment is a certain percentage of the fair market value that is determined by local assessors to be the total taxable value of land and additions on the property. | Land | Improvement |
|---|---|---|---|---|
| 2025 | $9,505 | $1,217,000 | $631,600 | $585,400 |
| 2024 | $9,735 | $1,213,800 | $601,500 | $612,300 |
| 2023 | $9,465 | $1,074,400 | $532,400 | $542,000 |
| 2022 | $9,575 | $949,000 | $471,100 | $477,900 |
| 2021 | $9,303 | $863,800 | $428,700 | $435,100 |
| 2020 | $8,927 | $831,200 | $424,700 | $406,500 |
| 2019 | $8,495 | $808,300 | $424,700 | $383,600 |
| 2018 | $8,115 | $769,900 | $404,500 | $365,400 |
| 2017 | $6,820 | $662,100 | $393,500 | $268,600 |
| 2016 | $6,658 | $655,300 | $393,500 | $261,800 |
| 2015 | $6,599 | $655,300 | $393,500 | $261,800 |
Source: Public Records
Map
Nearby Homes
- 35 Benedict Rd
- 203 County Rd
- 5 Zoli Ln
- 13 Laurel Hill Ct
- 60 Bourne Neck Dr
- 12 Turnberry Rd Unit 12
- 5 Sea Knoll Ct
- 566 Shore Rd
- 16 Amberwood Ct
- 4 Hollyhock Knoll Ct Unit 4
- 4 Hollyhock Knoll Ct Unit 4
- 1 Hollyhock Knoll Ct Unit 1
- 44 Cotuit Rd
- 4 Harbor Hill Dr
- 46 Holt Rd Unit B
- 46 Holt Rd
- 60 Sandwich Rd
- 40-A Lafayette Ave
- 20 Colony Ave
- 10 Sandy Ln
Your Personal Tour Guide
Ask me questions while you tour the home.