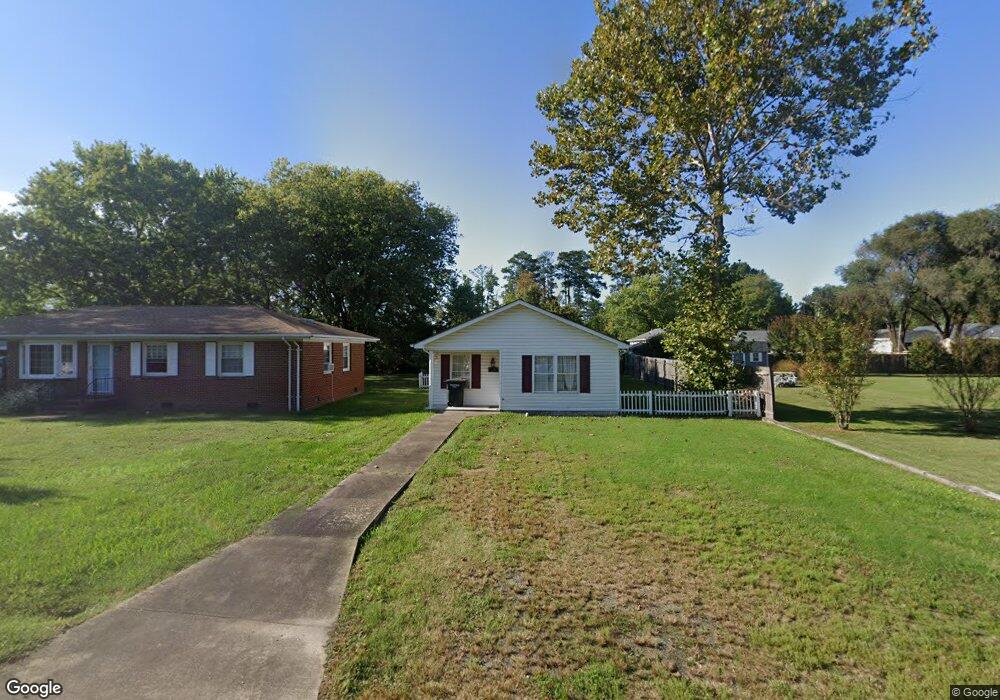
311 1st St Colonial Beach, VA 22443
Estimated Value: $317,923 - $380,000
Studio
2
Baths
1,648
Sq Ft
$208/Sq Ft
Est. Value
About This Home
This home is located at 311 1st St, Colonial Beach, VA 22443 and is currently estimated at $342,481, approximately $207 per square foot. 311 1st St is a home located in Westmoreland County with nearby schools including Colonial Beach Elementary School, Colonial Beach High School, and Monroe Bay Christian Academy.
Ownership History
Date
Name
Owned For
Owner Type
Purchase Details
Closed on
Aug 26, 2009
Sold by
Fannie Mae
Bought by
Pyer James E
Current Estimated Value
Home Financials for this Owner
Home Financials are based on the most recent Mortgage that was taken out on this home.
Original Mortgage
$68,000
Outstanding Balance
$43,882
Interest Rate
5.17%
Mortgage Type
New Conventional
Estimated Equity
$298,599
Purchase Details
Closed on
Apr 6, 2009
Sold by
Professional Foreclosure Corp
Bought by
Federal National Mortgage Association
Create a Home Valuation Report for This Property
The Home Valuation Report is an in-depth analysis detailing your home's value as well as a comparison with similar homes in the area
Home Values in the Area
Average Home Value in this Area
Purchase History
| Date | Buyer | Sale Price | Title Company |
|---|---|---|---|
| Pyer James E | $85,000 | -- | |
| Federal National Mortgage Association | $191,256 | -- |
Source: Public Records
Mortgage History
| Date | Status | Borrower | Loan Amount |
|---|---|---|---|
| Open | Federal National Mortgage Association | $68,000 |
Source: Public Records
Tax History
| Year | Tax Paid | Tax Assessment Tax Assessment Total Assessment is a certain percentage of the fair market value that is determined by local assessors to be the total taxable value of land and additions on the property. | Land | Improvement |
|---|---|---|---|---|
| 2025 | $843 | $200,800 | $39,200 | $161,600 |
| 2024 | $843 | $200,800 | $39,200 | $161,600 |
| 2023 | $803 | $200,800 | $39,200 | $161,600 |
| 2022 | $803 | $200,800 | $39,200 | $161,600 |
| 2021 | $787 | $164,000 | $39,200 | $124,800 |
| 2020 | $771 | $164,000 | $39,200 | $124,800 |
| 2018 | $656 | $164,000 | $39,200 | $124,800 |
| 2017 | -- | $164,000 | $39,200 | $124,800 |
| 2016 | $640 | $164,000 | $39,200 | $124,800 |
| 2015 | -- | $173,200 | $39,200 | $134,000 |
| 2014 | -- | $0 | $0 | $0 |
| 2013 | -- | $173,200 | $39,200 | $134,000 |
Source: Public Records
Map
Nearby Homes
Your Personal Tour Guide
Ask me questions while you tour the home.